HCI MIRI Limiting Contrast
Treatment of limiting contrast (Climit) for MIRI is based on in-flight measurements of the MIRI coronagraphs obtained during JWST commissioning and reported in Boccaletti et al. (2022). These results supersede the pre-flight predictions of Boccaletti et al. (2015) that previously formed the basis of this page.
See also: MIRI Coronagraphic Imaging, MIRI Bright Source Limits, MIRI Coronagraphs
Caution on Limiting Contrast
The information contained in this article is presented as a general guide based on commissioning measurements and post-launch experience. The ultimate contrast achieved in a science observation will depend on many factors, including but not limited to: the brightness and spectral type of the target and reference stars, the angular separation between target and reference (and any associated wavefront drift), the chosen exposure parameters, the chosen post-processing strategy, and the stability of the telescope wavefront across the observing window.
Limiting contrast, Climit(s), is the companion-to-host flux ratio of the faintest detectable companion at apparent separation s. It is the detection limit and the best that can be done.
The article HCI Contrast Considerations provides a general treatment of "contrast" (C), including Climit(s).
In-flight performance from Boccaletti et al. (2022)
Climit(s) for MIRI was initially estimated from pre-flight simulations published in Boccaletti et al. (2015). The first on-sky measurements of all 4 MIRI coronagraphs, obtained during commissioning in June 2022, are reported in Boccaletti et al. (2022) and now form the basis for limiting contrast guidance for MIRI.
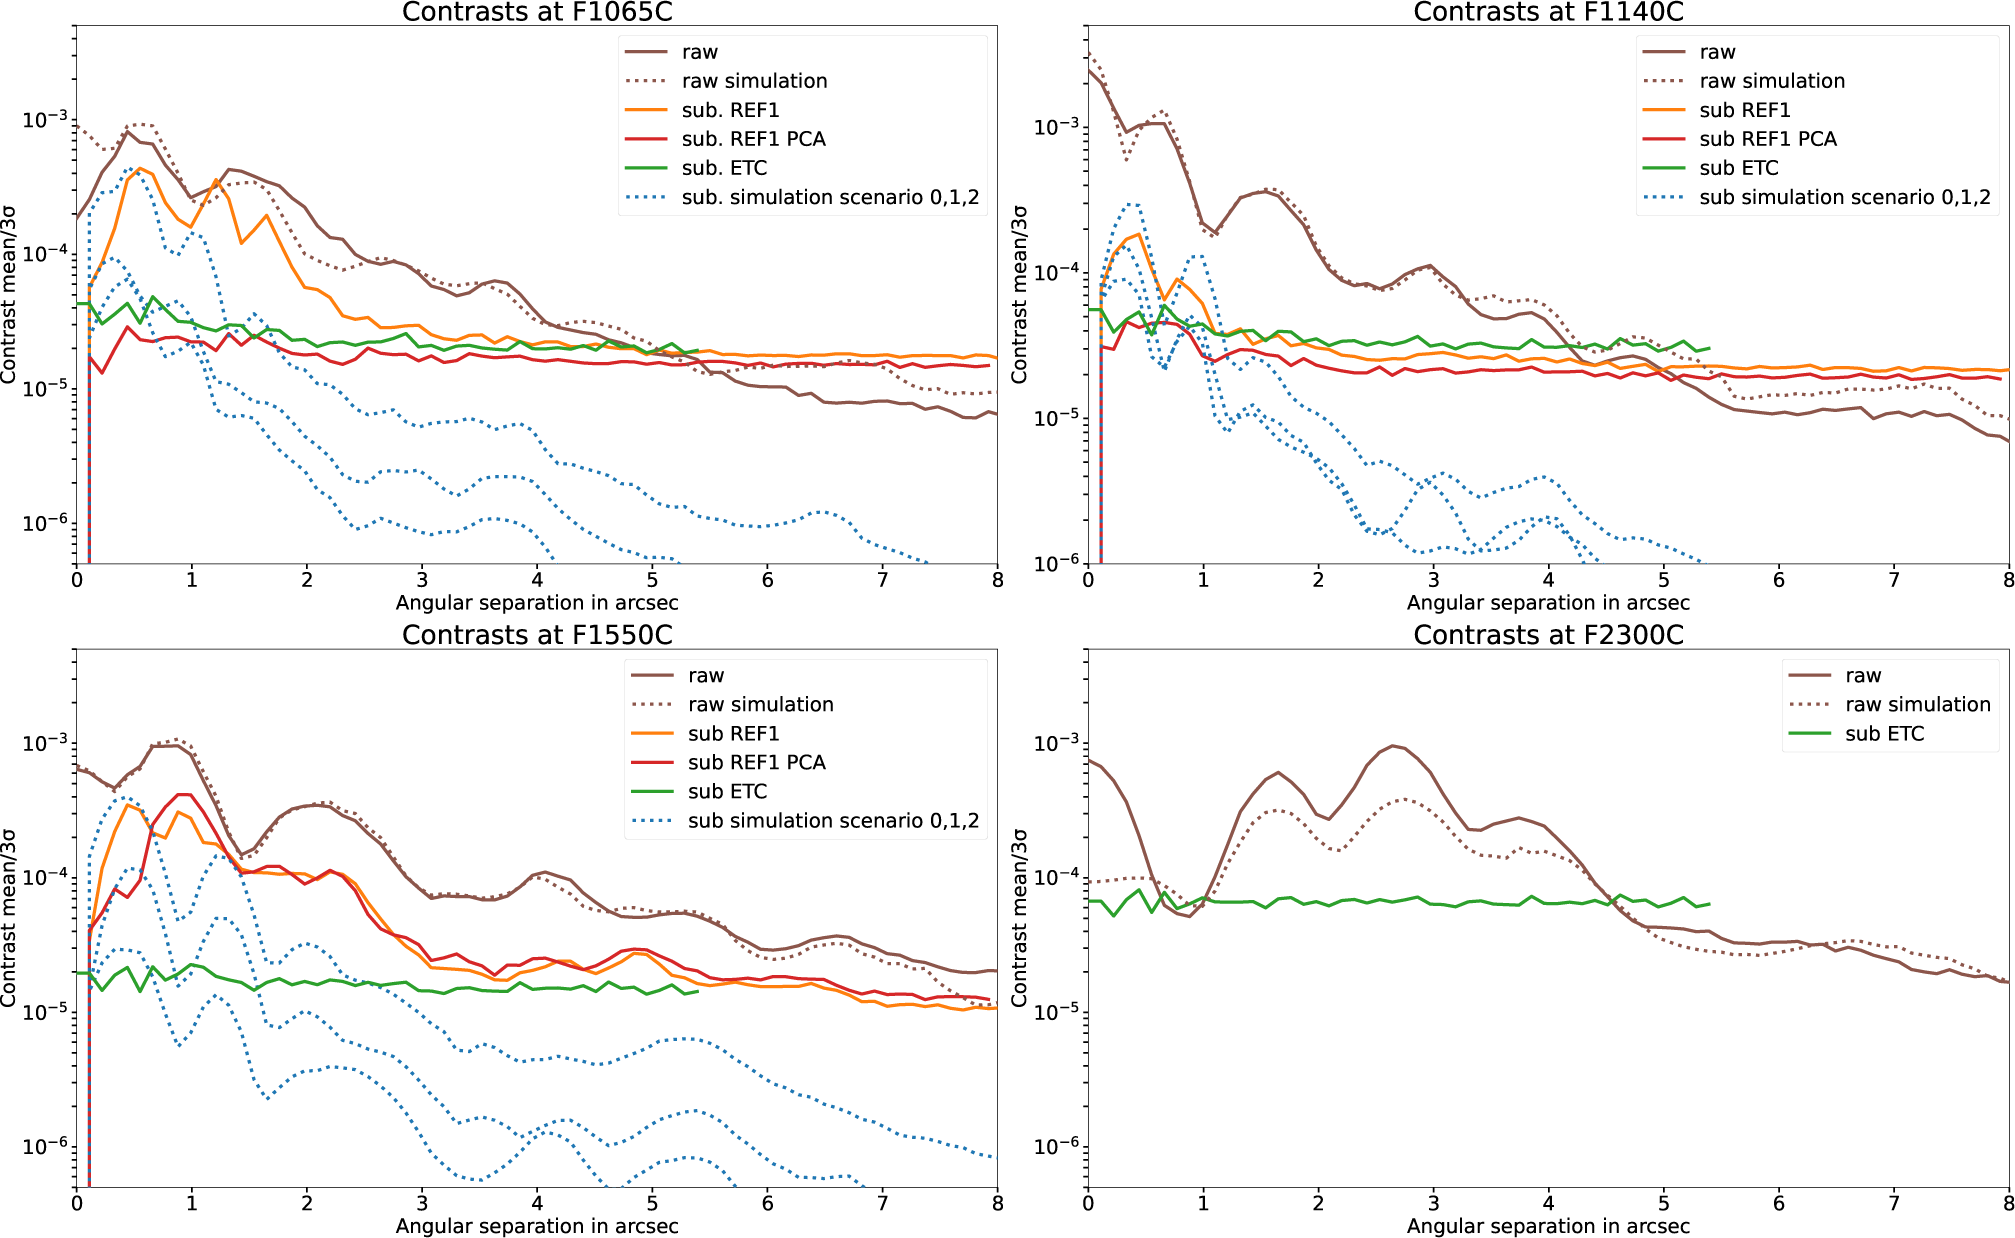
Figure 1 (below) shows the in-flight raw and 3σ reference star subtracted contrasts for each of the 4 MIRI coronagraphs, compared to the corresponding diffractive simulations and to the Exposure Time Calculator (ETC) prediction.
The "technical factors" behind the curves include:
- All 4 coronagraph/filter combinations measured on-sky: 4QPM_1065/F1065C, 4QPM_1140/F1140C, 4QPM_1550/F1550C, and LYOT_2300/F2300C
- Bright host stars at moderate mid-IR flux densities: HD 158165 (K = 4.07) for F1065C and F1140C, and HD 163113 (K = 2.75) for F1550C and F2300C
- For the 4QPM coronagraphs, a reference star (BD +30 2990 and HD 158896 at F1140C, BD +30 2990 at F1065C, HD 162989 at F1550C) was observed back-to-back with the target, using a 9-point small grid dither (SGD); no reference star was observed at F2300C
- A dedicated background exposure, obtained with the same filter and exposure parameters, to subtract the straylight "glow stick" pattern
- Two reference star post-processing methods: one-to-one subtraction of a single reference exposure, and Principal Component Analysis (PCA; Soummer, Pueyo, & Larkin 2012) on the 9 SGD reference frames
- An adopted detection threshold of 3σ, where σ is the azimuthal standard deviation in the reference subtracted image (normally distributed residuals assumed)
- JWST telescope wavefront and pointing performance as measured during MIRI coronagraph commissioning in June 2022
If the user's operating point (s, Cflux) lies above the relevant subtracted contrast curve, that source is estimated to be detectable under the commissioning-era assumptions and subject to the caveats discussed below.
Figure 1. In-flight contrast curves for the 4 MIRI coronagraphs
Click on the figure for a larger view.
Reproduced from Figure 5 of Boccaletti et al. (2022) under CC BY 4.0.
Measured raw (brown solid) and 3σ reference star subtracted contrasts for the 4 MIRI coronagraphic filters F1065C, F1140C, F1550C, and F2300C, compared to diffractive simulations (brown dashed) and the Exposure Time Calculator (ETC) prediction (green). Subtracted contrasts are shown for both the one-to-one (orange) and PCA (red) algorithms applied to a back-to-back 9-point SGD reference star exposure; reference stars were not observed at F2300C. The three "sub. simulation" curves correspond to the "best", "nominal", and "requirement" wavefront error and pointing scenarios defined in Table 3 of Boccaletti et al. (2022).
Boccaletti et al. (2022) tested both one-to-one subtraction (a single reference exposure subtracted from the target exposure) and PCA subtraction (a reference model constructed from a principal component decomposition of the 9 SGD reference exposures). Generally, it was found that one-to-one subtraction only provides a small gain with respect to the residual diffraction left behind the coronagraph, while PCA offers a more substantial attenuation. The per-filter subtracted contrasts vary as follows:
- For F1065C and F1140C, PCA subtraction using a single reference star observed back-to-back with the target achieves a 3σ contrast of 2–4 × 10⁻⁵ inside 1″, consistent with both the best-case simulation and the Exposure Time Calculator (ETC) noise floor prediction.
- For F1550C, the reference star subtracted contrast achieved during commissioning was substantially poorer than expected (~4 × 10⁻⁴ at 1″ versus the ~2 × 10⁻⁵ predicted by the ETC), owing to a primary mirror "tilt event" that occurred between the target and reference observations. The 4QPM_1550 mask itself is performing nominally; subsequent F1550C science observations (e.g., Carter et al. 2023) have demonstrated subtracted contrasts in line with expectations.
- For F2300C, no reference star subtraction was performed during commissioning, but subsequent science observations (e.g., Gáspár et al. 2023; Rebollido et al. 2024; Mâlin et al. 2024) confirmed that classical reference star subtraction can reach the expected background-limited floor (~4× higher than F1550C) at separations outside the 2.38″ Lyot IWA.
Important caveats on using these curves
The contrast curves in Boccaletti et al. (2022), and any curves adapted from them on this page, were measured to demonstrate the on-sky performance of the MIRI coronagraphs and to validate simulated data. As emphasized by the authors, they should not be used directly to evaluate the detectability of a specific exoplanet without further corrections.
In particular:
- The curves do not account for the coronagraphic field transmission of an off-axis companion. Companions near the IWA are strongly attenuated, and this must be accounted for separately.
- The curves do not incorporate the small sample statistics correction of Mawet et al. (2014).
- The curves were derived from observations of specific stars and converted to a flux contrast using off-axis PSF photometry. The achievable Climit(s) for a given target depend on the observing conditions, integration time, and target brightness through the underlying noise budget; observers should re-evaluate the expected sensitivity using the ETC for the specific target and exposure time.
References
Boccaletti, A., Cossou, C., Baudoz, P., et al. 2022, A&A, 667, A165
JWST/MIRI coronagraphic performances as measured on-sky
Boccaletti, A., Lagage, P. O., Baudoz, P., et al. 2015, PASP, 127, 633
The Mid-Infrared Instrument for the James Webb Space Telescope, V: Predicted Performance of the MIRI Coronagraphs
Carter, A. L., Hinkley, S., Kammerer, J., et al. 2023, ApJL, 951, L20
The JWST Early Release Science Program for Direct Observations of Exoplanetary Systems I: High Contrast Imaging of the Exoplanet HIP 65426 b from 2–16 μm
Gáspár, A., Wolff, S. G., Rieke, G. H., et al. 2023, Nature Astronomy, 7, 790
Spatially resolved imaging of the inner Fomalhaut disk using JWST/MIRI
Lajoie, C.-P., Soummer, R., Pueyo, L., et al. 2016, Proc. SPIE, 9904, 99045K
Small-grid dithers for the JWST coronagraphs
Mâlin, M., Boccaletti, A., Perrot, C., et al. 2024, A&A, 690, A316
Unveiling the HD 95086 system at mid-infrared wavelengths with JWST/MIRI
Mawet, D., Milli, J., Wahhaj, Z., et al. 2014, ApJ, 792, 97
Fundamental Limitations of High Contrast Imaging Set by Small Sample Statistics
Rebollido, I., Stark, C. C., Kammerer, J., et al. 2024, AJ, 167, 69
JWST-TST High Contrast: Asymmetries, Dust Populations and Hints of a Collision in the β Pictoris Disk with NIRCam and MIRI
Soummer, R., Pueyo, L., & Larkin, J. 2012, ApJL, 755, L28
Detection and Characterization of Exoplanets and Disks Using Projections on Karhunen-Loève Eigenimages