NIRISS Known Issues
Known issues specific to NIRISS data processing in the JWST Science Calibration Pipeline are described in this article. This is not intended as a how-to guide or as full documentation of individual pipeline steps, but rather to give a scientist-level overview of issues that users should be aware of for their science.
On this page
Specific artifacts are described in the Artifacts section below. Guidance on using the pipeline data products is provided in the Pipeline Notes section along with a summary of some common issues and workarounds in the summary section.
Information provided in this article affects all NIRISS observing modes. For mode-specific issues, see the NIRISS AMI, imaging, SOSS, and WFSS issues pages. Please also see NIRISS Calibration Status.
Artifacts
Instrumental artifacts that may affect observation planning or the interpretation of data obtained with NIRISS are covered below.
Imprint of occulting spots
Words in bold are GUI menus/
panels or data software packages;
bold italics are buttons in GUI
tools or package parameters.

Click on the figure for a larger view.
A flat field image using data from cryovacuum 3 testing to illustrate the 4 occulting spots across the top of the detector. This image is in the F200W filter.
Cross-hatching
Damage to the detector silicate substrate causes cross-hatching that affects pixel sensitivity, with the lower right corner being most affected. The maximum relative change in sensitivity to illumination is about 10%, though these effects are mostly mitigated during the flat_field step in the pipeline. Some residuals remain at the 1% level.

Click on the figure for a larger view.
Cross-hatching is most apparent in the bottom right of the detector and in the middle.
Imprint of epoxy voids
See also: NIRISS Detector Performance
During manufacture of the JWST NIR instruments, epoxy was used to fill the space between the HgCdTe detector and silicon ROIC (readout integrated circuit). Regions where the epoxy failed to flow, "epoxy voids" (Rauscher 2015), show up as brighter regions in the flat field, though they are not more sensitive than non-void pixels. The epoxy voids cover about 20% of the detector. The imprint of the epoxy voids, seen in Figure 3, are mostly removed during the flat_field step of the pipeline. However, the void edges have evolved between ground testing and flight, so some small residuals remain where these edges have changed over time.

Click on the figure for a larger view.
Pick-off mirror contamination
See also: NIRISS Optics and Focal Plane
Contaminants from the pick-off mirror in the NIRISS optical path imprint on the detector and can appear as blobs, streaks, or point-like sources, as shown in Figure 4. These features appear to be wavelength dependent and are mostly removed during the flat_field step.

Click on the figure for a larger view.
Detector defects
Areas of unresponsive pixels identified during ground testing also appear as detector defects as shown in Figure 5. These defects are marked as bad pixels in the bad pixel mask.

Click on the figure for a larger view.
Internal reflection, scattered light, and stray light
Scattered light artifacts that may affect observation planning or the interpretation of data obtained with NIRISS are covered below.
Ghosts
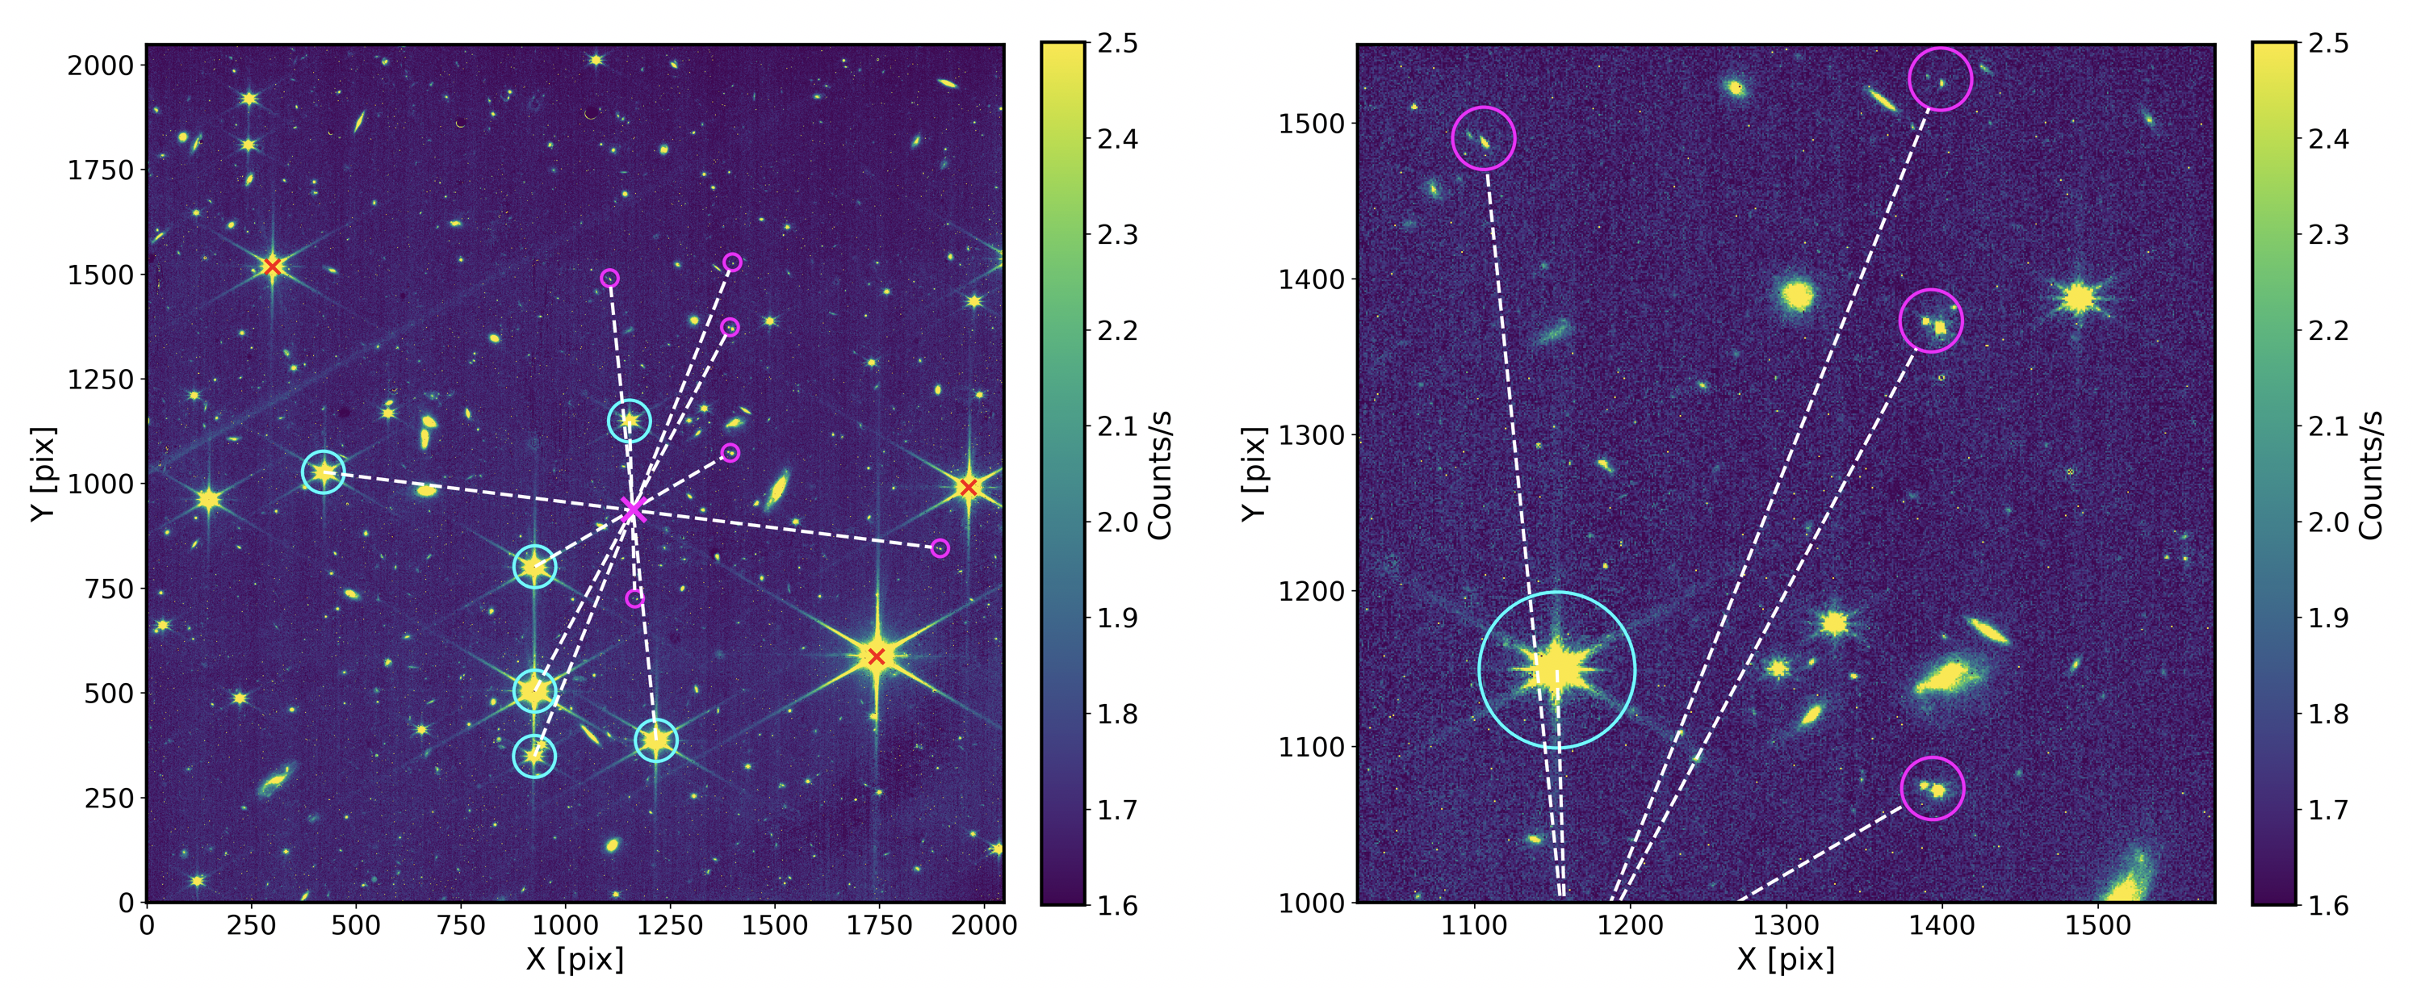
Internal reflections within the optical path of NIRISS can result in optical ghosts in NIRISS imaging and wide field slitless spectroscopy (WFSS) observations (Martel 2019). See the NIRISS Ghosts article for more information about ghosts in imaging observations, and how to identify ghosts when analyzing data. An example of ghosts observed from early inflight observations is shown in Figure 6. Dispersed ghosts are discussed in the NIRISS GR150 grisms article.
Click on the figure for a larger view.
Left: An example of bright stars that produce ghosts in a NIRISS image. The magenta X marks the ghost axis point (GAP), the point around which ghosts are reflected from the sources. The stars producing the ghosts are circled in cyan and the objects circled in magenta are the ghosts. The red Xs mark sources that would be expected to produce ghosts, but not are identified indicating that only certain regions in the detector are susceptible to producing ghosts. Right: A zoom-in of the image to illustrate the blobby morphology of ghosts, and the double ghosts produced in this particular filter (F150W). These images are from observation 116 in APT program 1063 with the F150W filter.
Light saber
See also: JWST Observatory Coordinate System and Field of RegardInflight observations revealed that light from a "susceptibility region" far away from the NIRISS field of view (2.0º < V2 < 5.0º, 12.4º < V3 < 12.8º) can scatter into the detector via a rogue path (i.e., light can enter the telescope aperture without reflecting off the primary or secondary mirror). In many cases, the scattered emission is from zodiacal light that causes a horizontal band about 25–30 pixels high across the full width of the detector, affecting 1%–2% of the detector, and is about 1% brighter than the background. If, however, there is a bright star with a near-infrared magnitude (J, H, K) brighter than ~2 (Vega mag) in the susceptibility region, this feature becomes sharper and brighter.
This light saber, an example of which is shown in Figure 7, produces a local background that is about 10% higher than the global background, but it is a factor of about 10-7 fainter than the star which causes it.
The light saber can affect both NIRISS imaging and WFSS observations. Spectra from the GR150C grism are dispersed along the light saber axis while spectra from the GR150R grism are dispersed vertically, which would increase the extent of the light saber in these exposures by another ~50–100 pixels (affecting ~5%–7% of all pixels).
The APT Aladin Viewer can be used to visualize the NIRISS susceptibility region for imaging and WFSS observations and to identify if any bright targets fall within the susceptibility region at any allowed position angle for an observation. An observer may wish to set a position angle constraint special requirement to avoid bright stars in the susceptibility region, but care must be taken to ensure such a constraint does not force an observation into the micrometeroid avoidance zone (MAZ). It is currently not recommended to constrain an observation in the MAZ to avoid the light saber.

Click on the figure for a larger view.
An example of an image where the light saber is observed. This image is through the F150W filter and is from the 4th dither position of observation 164 in APT program 1063 (jw01063164001_02201_00004_nis_cal.fits). The light saber appears when there is a bright star in a susceptibility region where light can scatter into NIRISS from a rogue path.
Anomalous spikes
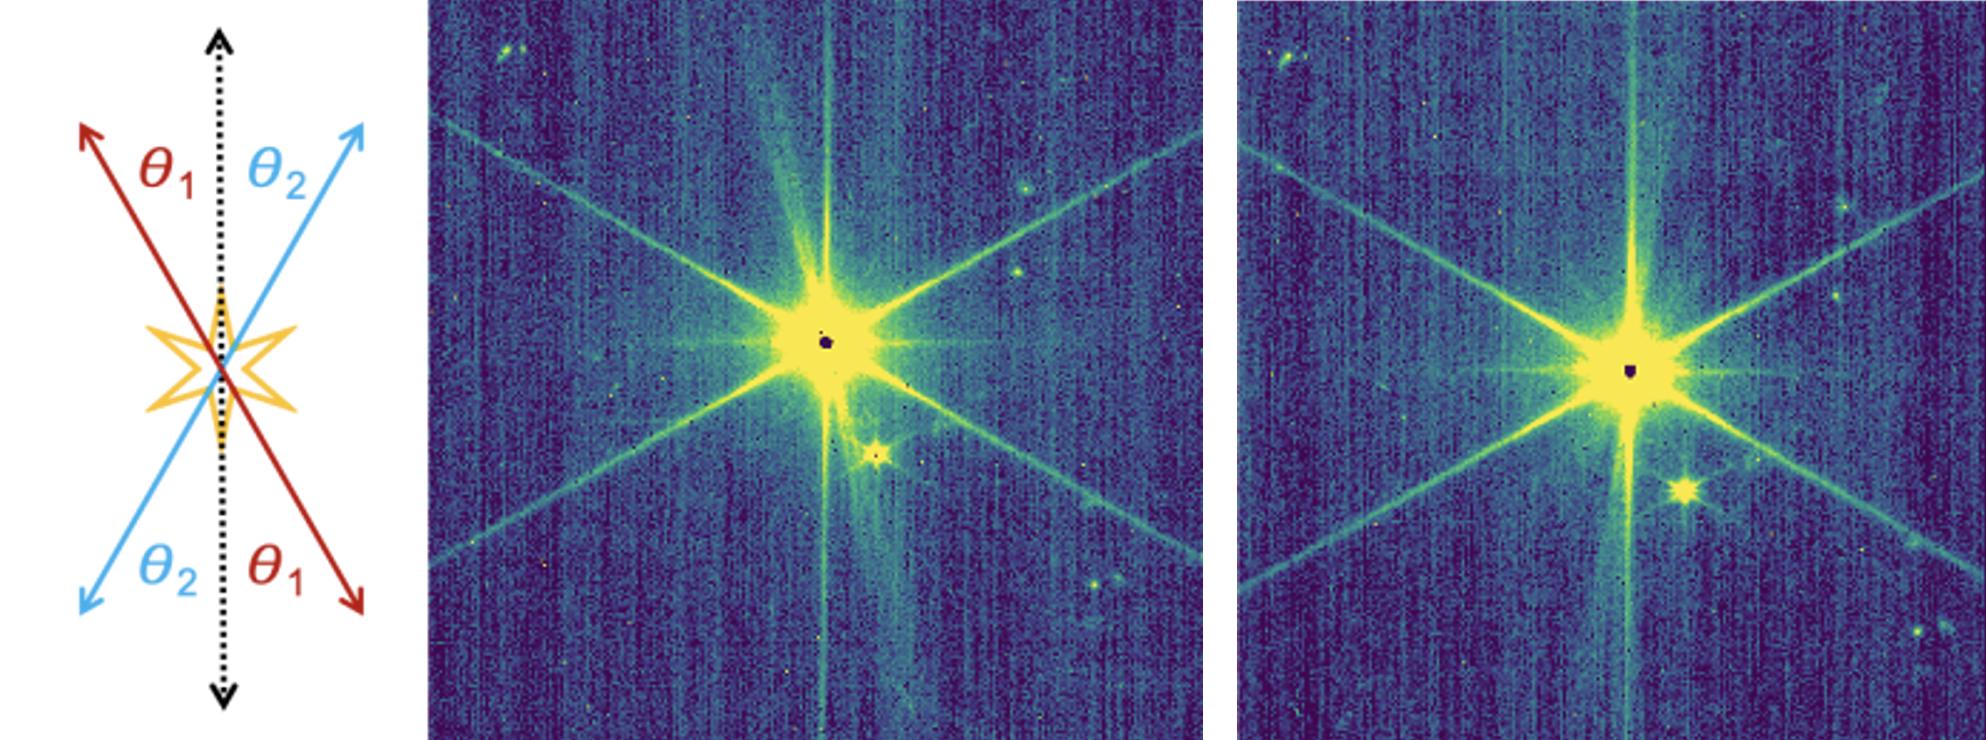
Anomalous spikes are observed in bright stars in the short wavelength NIRISS filters (F090W, F115W, F140M, F150W, F158M, and F200W). These spikes are more diffuse than diffraction spikes, and come in 2 flavors (Figure 8): 11 and 5 o'clock spikes and 1 and 7 o'clock spikes. The angle of the anomalous spikes is a strong function of detector X position: θ1 has a maximum value of 25º at X = 0 and θ2 has a maximum value of -12º at X = 2048 (with θ1 defined as positive and θ2 defined as negative). The transition from the 11/5 o'clock spikes to the 1/7 o'clock spikes occurs at X ~ 1,400. The intensity of the anomalous spikes is strongest in F090W, and decreases with filter wavelength. The 11/5 o'clock spikes were also seen in ground testing (Martel 2019).
Click on the figure for a larger view.
Left: Schematic illustrating how angles of anomalous spikes are measured. Middle: An example of a star with 11/5 o'clock spikes. Right: An example of a star with 1/7 o'clock spikes. Real diffraction spikes are sharper and and narrower.
Stray light
Light from stars outside the NIRISS field of view can scatter off the focal plane array (FPA) baffle into the NIRISS detector and affect both imaging and WFSS observation. The region of the detector affected by the baffle is 172 pixels wide and extends from 45 to 217 pixels outside of the detector. Early in-flight observations revealed that when a star is placed between 45 to 175 pixels away from the detector, scattered light is sometimes visible at the edges of the detector (Figure 9). When planning observations, users should be aware that a bright star within ~200 pixels (~13") of the edge of the NIRISS detector could potentially cause scattered light. So far, stray light has been observed when a star of brightness K ~ 11.5 (Vega) or brighter has been within 200 pixels of the detector.

Click on the figure for a larger view.
Left: Stray light is visible in the lower left corner of this image from a star that is offset 110 pixels off the edge of the detector. This image is from observation 4 in APT program 1095 and uses the F090W filter. The star causing the scattered light has a magnitude of K = 11.4 (Vega).
Right: Stray light is visible on the right edge of the detector from a star that is offset by 80 pixels off the edge of the detector. This image is from observation 114 in APT program 1063 and uses the F115W filter. The star causing the scattered light has a magnitude of K = 10.8 (Vega).

Click on the figure for a larger view.
Examples of streaks (circled in red) in NIRISS images, tentatively linked to bright stars ~180–195 pixels offset from the left edge of the detector.
Left: This image is from observation 111 in APT program 1063 and is with the F200W filter.
RIght: This image actually shows 2 streaks, which are coincident with 2 stars off the left edge of the detector. The light saber and a diffraction spike from a star outside the NIRISS field of view are also visible. This image is from observation 100 in APT program 1086 and is with the F150W filter.
Diffraction spikes from stars outside the field of view
Sufficiently bright stars outside of the NIRISS field of view can have diffraction spikes that impinge on the detector. An example of this is shown in Figure 11, where the likely stars causing these spikes have magnitudes of J ~ 4.5 (Vega). Users can consider imposing a position angle constraint when planning observations, should there be bright stars nearby, depending on whether low background across the whole detector is crucial for the science goals of an observing program.

Click on the figure for a larger view.
An image where diffraction spikes from 2 stars outside of the NIRISS field of view fall onto the detector. The stars causing these out-of-field diffraction spikes have magnitudes J ~ 4.5 (Vega). This image is from observation 181 in APT program 1063.
Pipeline notes
The topics below affect all modes and reflect common questions about how to improve the quality of the data from the pipeline. Detector-level corrections and calibrations are applied during the calwebb_detector1 stage of the pipeline. By default, all steps in the calwebb_detector1 stage of the pipeline are run for NIRISS except for the ipc and gain_scale steps
1/f noise
JWST's near-infrared HgCdTe detectors have a correlated noise, known as 1/f noise, that is introduced by the detector readout system (Moseley et al. 2010). It results in stripes in the vertical, or fast-read axis, in each group of an integration and can be a limiting factor in subsequent analysis. Community tools are available to subtract this noise. Investigation is underway to implement a 1/f noise correction into the pipeline to improve the quality of NIRISS data.
Persistence
While the persistence step is set to run by default, this step does not automatically correct the science data for persistence. The persistence step creates a "_trapsfilled.fits" file which is a model that records the number of traps filled at each pixel at the end of an exposure. This file would be used as an input to the persistence step, via the input_trapsfilled argument, to correct a science exposure for persistence. Since persistence is not well calibrated for NIRISS, this correction is not performed and the "_trapsfilled.fits" file is not used.
To run the pipeline in Python to turn off the step to create the "_trapsfilled.fits" file:
from jwst.pipeline import Detector1Pipeline
rate_file = Detector1Pipeline.call(uncal_file, steps={'persistence': {'skip':True}})
Charge migration
The charge_migration step is particularly important for NIRISS images to mitigate apparent flux loss in resampled images due to the spilling of charge from a central pixel into its neighboring pixels (see Goudfrooij et al. 2024 for details). Charge migration occurs when the accumulated charge in a central pixel exceeds a certain signal limit, which is ~25,000 ADU. This step is turned on by default for NIRISS imaging, wide field slitless spectroscopy (WFSS), and aperture masking interferometry (AMI) modes, but not for the single object slitless spectroscopy (SOSS) mode. Different signal limits for each filter are provided by the "pars-chargemigrationstep" parameter files which are available via the Calibration Reference Data System (CRDS). See Running the JWST Science Calibration Pipeline article for information about how to use parameter reference files when running the pipeline.
As currently implemented, this step does not attempt to track the charge migration and put the charge back to where it should have been. Instead, the step truncates the ramp for pixels where the signal goes above the signal limit threshold, and also applies this ramp shortening to the immediately adjacent pixels which are receiving the charge from the high signal pixel. This improves the count rate calculation, and hence the flux accuracy, for the pixels affected by charge migration.
Users can specify a different signal limit by running this step with the signal_threshold flag and entering another signal limit in units of ADU:
from jwst.pipeline import Detector1Pipeline
rate_file = Detector1Pipeline.call(uncal_file, steps={'charge_migration': {'signal_threshold':25000}})
Correcting snowball halo residuals
See also: Shower and Snowball Artifacts
Large cosmic ray impacts cause features known as snowballs on near-infrared detectors which can affect up to hundreds of pixels. The effects of the snowballs are mostly flagged in the jump step and removed, although this is not always true for NIS readout. However, there are commonly uncorrected low-level signal residuals surrounding snowballs that can be removed by running the jump step with the expand_large_events parameter set to True.
By default, this option is turned on for the NIRISS imaging, WFSS, and AMI modes but not the SOSS mode. The chosen default parameters for NIRISS can be found in the "pars-jumpstep" reference file. Users may wish to alter parameters to optimize removal of snowball residuals. Available parameters are discussed in the Detection and Flagging of Showers and Snowballs in JWST Technical Report (Regan 2023).
Summary of common issues and workarounds
N/A; see Known Issues pages for AMI, imaging, SOSS, and WFSS modes.
Links
NIRISS imaging ghost identification tool
References
Doyon, R., Hutchings, J., Rowlands, N., et al. 2010, SPIE, 7331, 7331E
The JWST tunable filter imager (TFI)
Goudfrooij, P. et al. 2024, PASP, 136, 4503
An Algorithm to Mitigate Charge Migration Effects in Data from the Near Infrared Imager and Slitless Spectrograph on the James Webb Space Telescope
Martel, A. 2019 JWST-STScI-004877
The Ghosts of NIRISS: Imaging
Moseley, S. H., et al. 2010 SPIE Proceedings Vol. 7742
Reducing the read noise of H2RG detector arrays: eliminating correlated noise with efficient use of reference signals
Rauscher, B. J., 2015, PASP, 127, 1144
Teledyne H1RG, H2RG, and H4RG Noise Generator
Regan, M. 2023, JWST-STScI-008545
Detection and Flagging of Showers and Snowballs in JWST