JWST ETC Defining an Extended Source
The JWST Exposure Time Calculator (ETC) can perform calculations using extended sources that may be a better fit to a science target than a point source. Users can create an extended source and alter it size, orientation, flux distribution profile, and flux normalization.
On this page
Words in bold are GUI menus/
panels or data software packages;
bold italics are buttons in GUI
tools or package parameters.
Create a new extended source
A new source can be created by clicking the NEW button within the Select a Source pane. This creates a new row in the source table with a default name, and shows the number of calculations equals 0 implying that this source is initially not associated with any scene or calculation. The default new source is a point source with a flat continuum. A new source may also be created by using the Copy Source option available under the Copy/Delete drop-down menu at the top of the Scenes and Sources page. This will create a new row in the source table with the same source name, but is not associated with any scene or calculation. Once the source is added to a scene and used in a calculation the information gets updated in the Select a Source pane. The scenes and sources are interactively linked.
To change the default point source to an extended source, select the Shape tab in the Source Editor pane. Click the radio button for Extended. New options for defining the properties of the extended source will appear; these are described in more detail in the next section below.
Define the properties of the new extended source
Flat
The flat profile is a simple uniform ellipse whose dimensions are defined by the Semi-Major Axis and Semi-Minor Axis parameters. Because there is a stair-step discontinuity at the outer edge, flat profiles cannot be normalized to surface brightness at a scale radius.
The user can define the Semi-Major Axis and Semi-Minor Axis for this flux distribution. These values may be equal, in which case a circular source is defined.
There is a bug in the ETC that leads the Semi-Major Axis and Semi-Minor Axis to correspond to the x and y dimensions of the extended source, respectively. As such, the Semi-Minor Axis can be larger than the Semi-Major Axis and the ETC will not produce a warning.
2D Gaussian
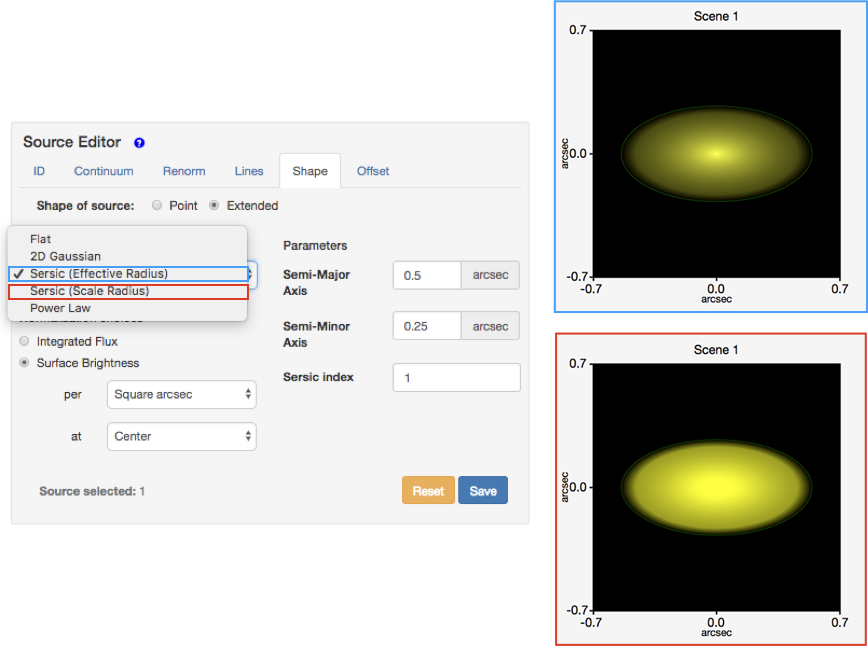
For the 2D Gaussian profile the specified σx and σy correspond to the Gaussian sigma along the two axes. It corresponds to the Sersic (Scale Radius) case when n=0.5 and the scale semi-major axes are increased by a factor of sqrt(2).
Sersic (Effective Radius)
The Sersic (Effective Radius) profile is defined such that half the flux lies within the specified radius (Graham, A. & Driver, S.P. 2005 equation 1). The intensity profile is described by the equation:
I(r) = I_0e^{-b\left[\left(\frac{r}{r_{eff}}\right)^{1/n}-1\right]},
where r_{eff} is the effective radius, n is the Sersic index, and b is the shape parameter calculated such that half the flux will lie within the effective radius:
d = \sqrt{\left(\frac{x}{semi-major}\right)^2+\left(\frac{y}{semi-minor}\right)^2},
profile = e^{-b(d^{1/n}-1)}.
The user can define the Semi-Major Axis and Semi-Minor Axis for this flux distribution. These values may be equal, in which case a circular source is defined.
Sersic (Scale Radius)
The Sersic (Scale Radius) profile is defined using scale-lengths (Graham, A. & Driver, S.P. 2005 equation 14). The intensity profile is described by the equation:
I(r) = I_0e^{-\left(\frac{r}{r_{scale}}\right)^{1/n}},
where r_{scale} is the scale length where I(r) = I_0/e and n is the Sersic index. The ellipticity is governed by specifying the Semi-Major Axis and Semi-Minor Axis, and they are used as follows:
d = \sqrt{\left(\frac{x}{semi-major}\right)^2+\left(\frac{y}{semi-minor}\right)^2},
profile = e^{-d^{1/n}}.
The integration is performed in 2D from -∞ to +∞ and is not truncated at the axes, as it may appear from the Scene Sketch.
The options for this flux distribution are identical to those for the Sersic (Effective Radius) shown in Figure 5 above.
Power Law
The Power Law profile is defined as:
I(r) = I_0r^{-k},
where the distance r from the center is defined by:
r = \sqrt{\left(\frac{x}{r_{core}}\right)^2+\left(\frac{y}{r_{core}}\right)^2}.
This profile is normalized at each wavelength by the total flux in the profile at that wavelength:
total = \pi r_{core}^2+2\pi\left(\frac{r_{core}^2}{k-2}\right).
The configurable parameters for this profile are the Core Radius, r_{core}, which defines the size of the flat central circular core, and the Power Law index (k) which must be a positive value between 0 and 10.
Because this power law does not converge for k < 2, the only available normalization option is to normalize to the surface brightness at the center (the flat core).
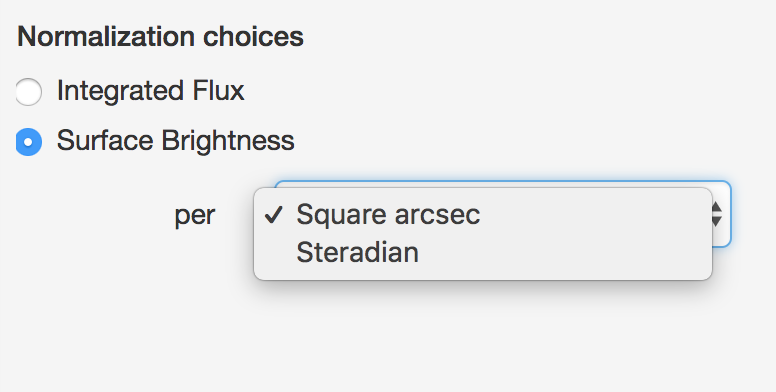
Normalization choices
Selecting Surface Brightness as the Normalization choices option automatically changes the units under the Renorm tab to read either per Square arcsec or per Steradian.
The ETC is unable to distinguish between units of integrated flux (i.e., mJy or MJy) from surface brightness (i.e., mJy/sr or MJy/square arcsec) in user-supplied spectra. If the user uploads a spectrum with the second column in surface brightness units, the source that the spectrum is applied to must be an Extended source with Surface Brightness selected as the Normalization choices option, otherwise the spectrum will not be properly applied to the source.
Other extended source properties
All other extended source properties defined under the Continuum, Renorm, Lines, and Offset tabs are handled in the same manner as for point sources, as described in the JWST ETC Defining a New Source article.
Examining the extended source
The extended sources that are created may be examined in the Scene Sketch and the Source Spectrum Plots pane to ensure that the desired parameters for spectral characteristics, morphology, and location in the scene have been applied. The Source Spectrum Plots pane displays the spectrum for all the sources that have been selected using the checkboxes in the Select a Source pane. These plots can be used to ensure that the source spectrum is correct (e.g., checking that the emission lines have been applied at the correct wavelength and line strength).
The Scene Sketch requires that the sources to be examined are already placed in a scene. This sketch can be used to examine the source location and orientation. The Scene Sketch is also useful for examining complex 2D source geometries that can be created by adding multiple sources (point and/or extended) to describe different components of an astronomical source or scene.
There is no limit to the size of an extended source that can be created, but the user should be aware of the maximum scene size for each observing mode. The Scene Sketch axes are dynamic and will show the full extent of a source of any size; this does not mean the whole scene is used in the calculation.
Deleting the extended source
A extended source can be removed from the current source library by using the DELETE button in the Select a Source pane. When the source to be removed is selected by highlighting the row in the source table, all the scenes that use the source will be indicated by the rows that are highlighted in green on the Select a Scene pane. Similarly, all the calculations which use the scenes containing the selected source will also be highlighted in green in the Used in Calculations pane.
The green highlight is intended to make the user aware of the scenes and calculations that are affected by deleting or modifying the selected source. This feature is particularly important because the scenes, sources, and calculations are interlinked in the ETC.
Extended source sample workbooks
The list of sample workbooks includes 2 options that are relevant to extended sources: "Extended Source Imaging" and "Extended Source Templates."
The "Extended Source Imaging" workbook presents a scene with 2 extended galaxies and provides examples of how to set up extended sources and use them in calculations.
The "Extended Source Templates" workbook provides a handful of useful shapes made out of ellipses (the ETC only allows scenes to be populated with elliptical sources). These shapes include a circular ring, an elliptical ring (or a circular ring seen edge on), a ring arc, a star cluster, and a comet. This workbook does not include any calculations and the individual sources have the default normalization, making it a perfect starting point for running ETC calculations of more complex extended sources.
References
Graham, A.W., Driver, S.P., 2005, Publication of the Astronomical Society of Australia, 22, 118
A concise reference to (projected) Sérsic R1/n quantities, including concentration, profile slopes, Petrosian indices, and Kron magnitudes


