MIRI Sensitivity
The sensitivity model for JWST's Mid-Infrared Instrument (MIRI) incorporates ground testing measurements to model parameters such as background, photon conversion efficiency, encircled energy, and detector performance.
On this page
The performance of JWST has been measured directly at both the component and system level using the fully assembled MIRI flight model in a flight-like radiative environment with a well-characterized radiometric source (Glasse et al. 2015). The results of the JWST throughput measurements have been integrated into a sensitivity model that includes the following components: (1) background, (2) photon conversion efficiency (PCE), (3) encircled energy, and (4) detector performance (Pontoppidan 2016).
The values in the table and plots below were obtained from ETC 6.0.
Continuum and line sensitivities
The tables and figures below show point source sensitivity values for a 10 ksec (10,000 s) observation to S/N = 10.
Table 1. Minimum detectable flux densities for a S/N = 10 in 10 ksec for MIRI imaging filters assuming FULL array and an unresolved point source
| Filter | Low Background Detection Limit (μJy) |
|---|---|
| F560W | 0.14 |
| F770W | 0.25 |
| F1000W | 0.47 |
| F1130W | 1.05 |
| F1280W | 0.85 |
| F1500W | 1.21 |
| F1800W | 2.46 |
| F2100W | 4.78 |
| F2550W | 15.6 |
Figure 1. Expected point source continuum sensitivity for the various MIRI instrument modes
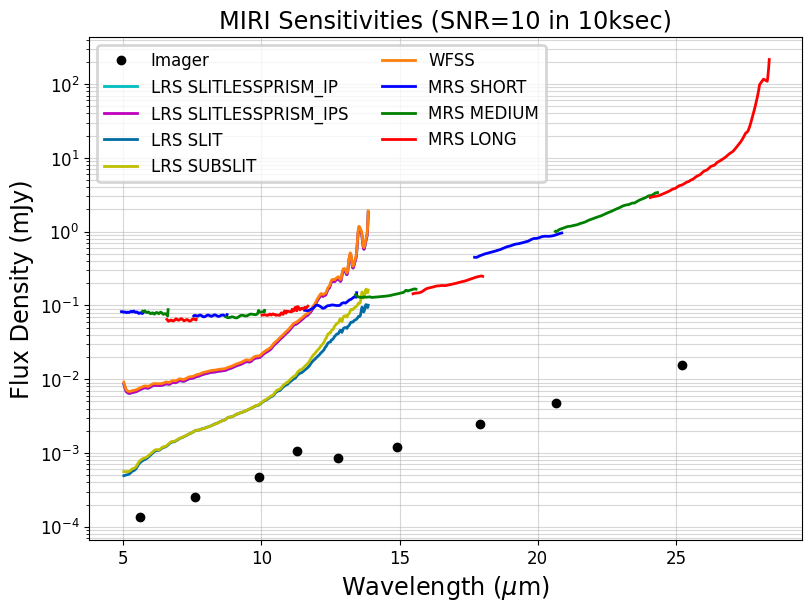
MIRI point source continuum sensitivity plot for the medium-resolution spectrometer (MRS), low resolution spectrometer (LRS), wide field slitless spectroscopy (WFSS), and imager (black circles) configurations. Values plotted represent the minimum detectable signal corresponding to S/N = 10, in 10,000 seconds of on-source integration time. For spectroscopic modes the numbers represent continuum sensitivities, with S/N calculated per spectral pixel.
Note: Sensitivity plots are based on in-flight measurements and on ETC 6.0. The ETC should always be used to obtain the most up-to-date numbers for science programs.
Figure 2. Expected point source line sensitivity for the various MIRI instrument modes
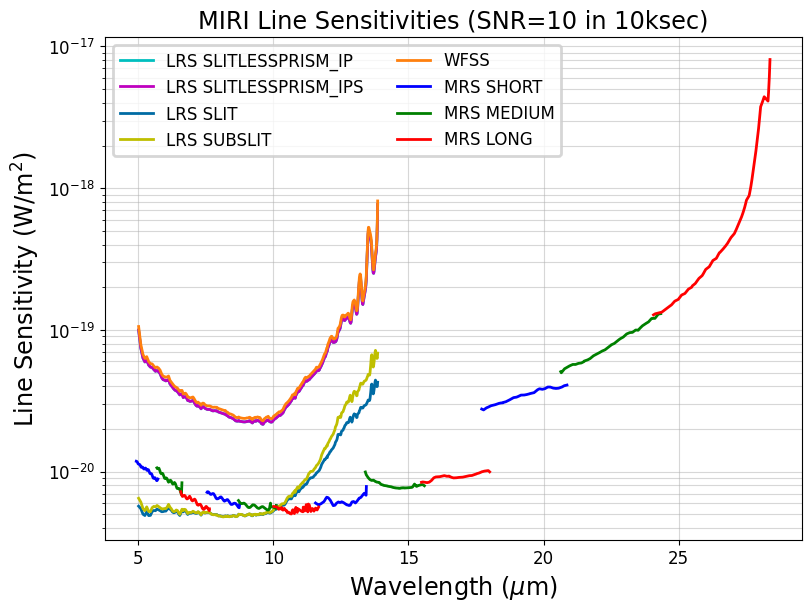
MIRI point source line sensitivity plot for the medium-resolution spectrometer (MRS), low resolution spectrometer (LRS), and wide field slitless spectroscopy (WFSS) configurations. Values plotted represent the minimum detectable signal corresponding to S/N = 10, in 10,000 seconds of on-source integration time.
Note: Sensitivity plots are based on in-flight measurements and on ETC 6.0. The ETC should always be used to obtain the most up-to-date numbers for science programs.
MRS time-dependent sensitivity
The MRS photometric calibration is additionally complicated by a time-dependent evolution in the effective count rate registered by the instrument that was observed during the first year of operations (see JWST Observer). The time-dependent evolution is taken into account in the JWST Exposure Time Calculator and is estimated for end-of-mission from ETC 5.0 onward. A detailed description of the MRS calibration and improvements in the pipeline to account for the time-dependent evolution is given on the MIRI MRS Calibration Status page.
Imager time-dependent sensitivity
The MIRI imager experiences a time-dependent reduction in observed count rates at wavelengths longward of F1280W; this count rate loss is similar to the MRS, but of a significantly smaller magnitude. More details on this can be found on the MIRI Imaging Calibration Status page. This count rate loss is estimated for end-of-mission and is included in ETC 4.0 and newer versions.
References
Glasse, A., et al., 2015, PASP, 127, 686
The Mid-Infrared Instrument for the James Webb Space Telescope, IX: Predicted Sensitivity
Pontoppidan, K. 2016, Proc of SPIE, 9910, 16
Pandeia: a multi-mission exposure time calculator for JWST and WFIRST