MIRI Imaging Known Issues
Known issues specific to MIRI imaging data processing in the JWST Science Calibration Pipeline are described in this article. This is not intended as a how-to guide or as full documentation of individual pipeline steps, but rather to give a scientist-level overview of issues that users should be aware of for their science.
On this page
Specific artifacts are described in the Artifacts section below. Guidance on using the pipeline data products is provided in the Pipeline Notes section along with a summary of some common issues and workarounds in the summary section.
Please also refer to MIRI Imaging Calibration Status for an overview of the current astrometric and flux calibration of MIRI imaging data products.
Artifacts
Imager "scar"
The imager scar consists of a diagonal feature on the top-left part of the MIRI imager, centered at pixel (428, 987) with a length of 16 pixels. This is related to a scratch on the surface of the detector. Although the pixels are responsive, this feature can scatter the light in both directions perpendicular to the scratch.
When the pixels associated with the scar are uniformly illuminated (no sources and just background), 2 diagonal features can run parallel to the scar (Figure 1). These stripes are brighter than the local background and their position and width change as a function of wavelength.
Figure 1. Location of the imager scar
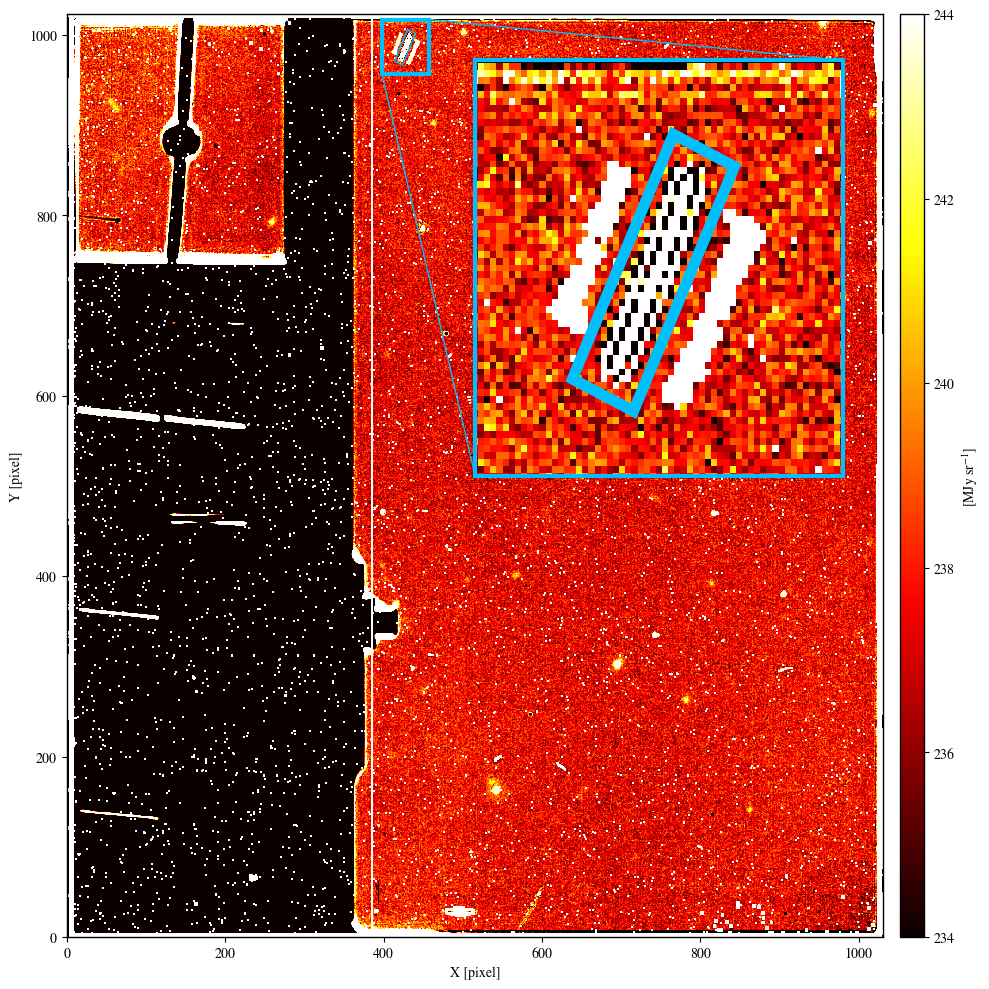
Click on the figure for a larger view.
MIRI F2100W image of PID 1040. The imager scar (highlighted by a light-blue rectangle in the zoomed-in panel) is located in the top-left part of the MIRI imager. The 2 diagonal features that run parallel to the scar are caused by light scattered in both directions perpendicular to the scratch, and are present when the scar is uniformly illuminated (no sources and just background).
If a bright source is imaged on these pixels, its light is scattered on the detector perpendicular to the scar creating a peculiar structure different from the classical point-like profile the same source would have in a different part of the imager (Figure 2).
Figure 2. Bright source imaged on the scar
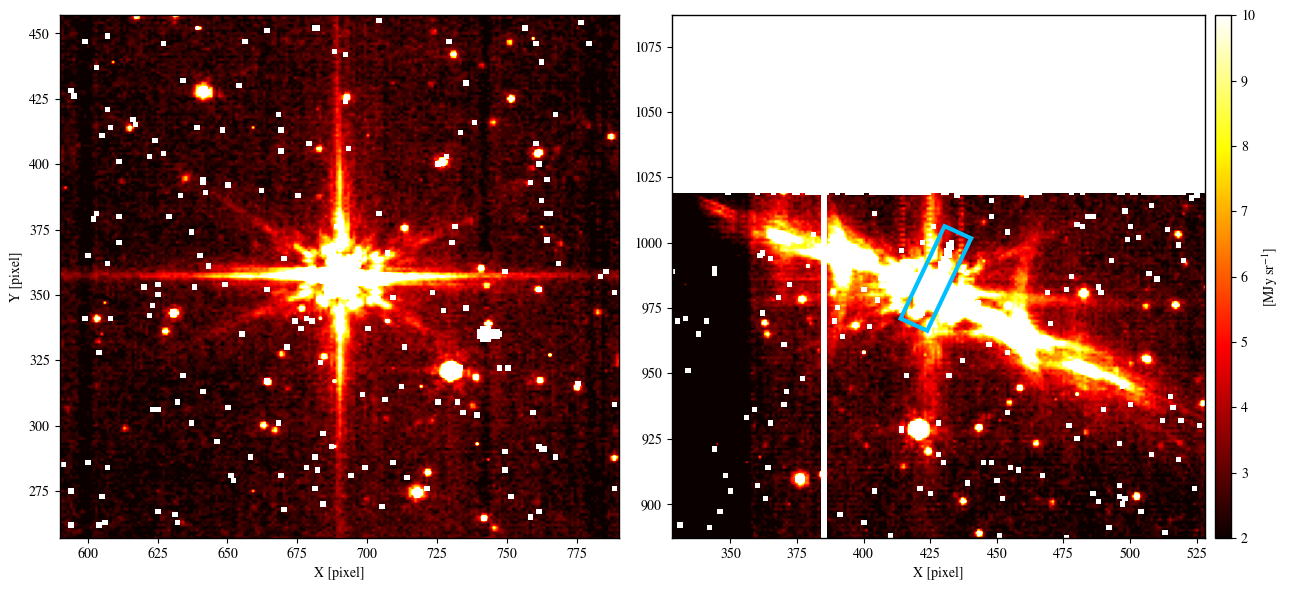
Click on the figure for a larger view.
Example of a point source imaged on top of the MIRI imager scar. In these 2 MIRI F560W images of PID 1518, the profile of the same bright star changes significantly when the star is imaged on pixels far from (left panel) or associated with (right panel) the scar. As in Figure 1, the light blue rectangle in the right panel marks the location of the scar.
Imager bad pixels
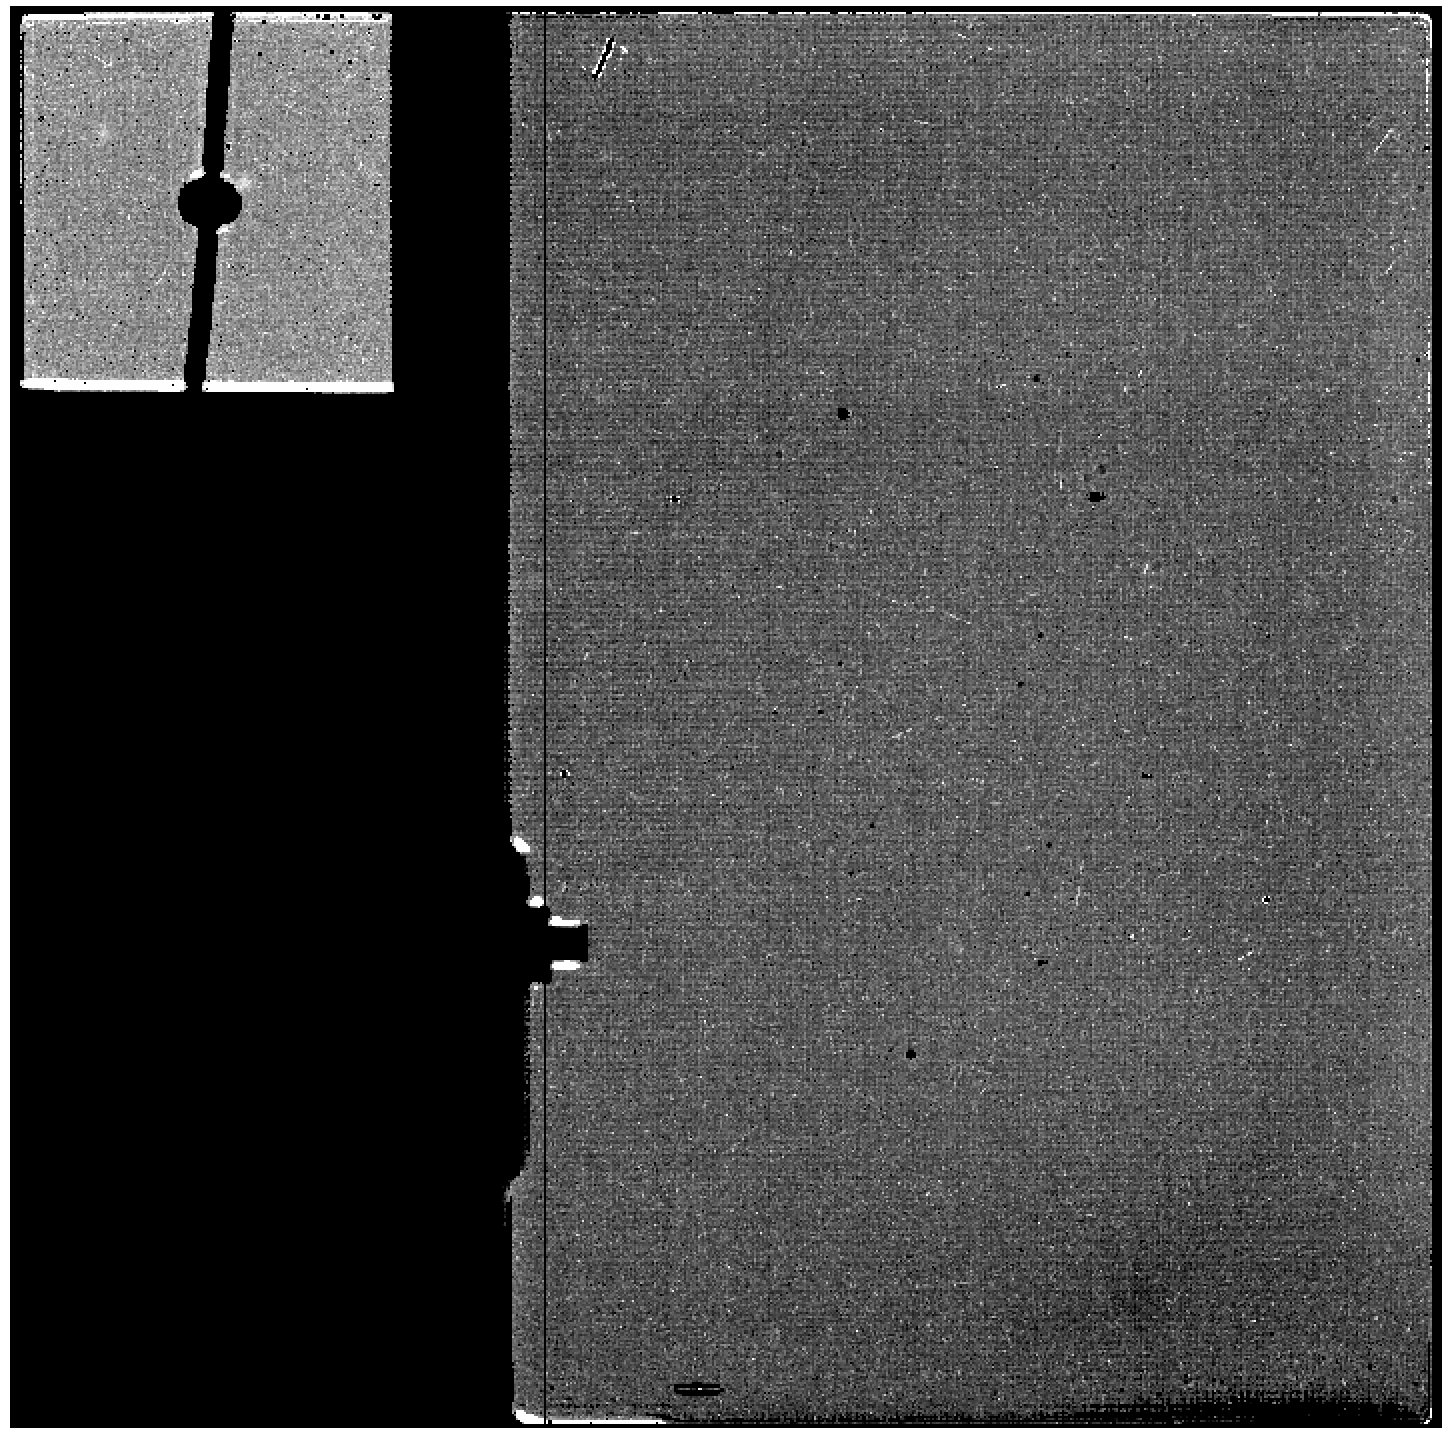
The MIRI imager detector has several pixels that are flagged based on ground testing and in-orbit observations. These pixels are flagged as "DO_NOT_USE" (value = 1) in the flight bad pixel mask (Figure 3), and the pipeline will not use those pixels. In addition, two of the columns (385 & 386) on the MIRI imager array are shorted. These are also flagged in the bad pixel mask as "DO_NOT_USE".
Figure 3. MIRI imager bad/hot/dead pixel mask
Click on the figure for a larger view.
Imager flat field bad pixel mask (black). The vertical line is the mask for the shorted columns. Note that bad pixels are flagged "DO_NOT_USE" (value = 1).
Cosmic ray showers
See also: Shower and Snowball Artifacts
Persistence
When a bright target falls on the MIRI detector or the detector is subject to a snowball, even when it is not actively being used for an observation, residual charge (persistence) remains behind in the affected pixels and decays away with a characteristic e-folding time. The brightness of the target, the duration of time it spends at a specific location on the detector, and the time until the next MIRI observation all contribute to the strength of the lingering persistence, which can remain even hours after impingement by a bright target. The decay then competes against accumulation of new charge, resulting in a count rate that is depressed compared to the actual count rate. This in turn affects the ramp fitting step, resulting in underluminous pixels (Figure 4).
There are currently no mitigations for this effect implemented in the pipeline, but users can manually mask underluminous pixels affected by persistence by flagging them as "DO_NOT_USE" (value = 1) in the data quality (DQ) array prior to dither combination in Stage 3.
Another possible mitigation technique is to combine the dithers to generate a median background image, since the persistence is fixed in location on the detector, and then subtract this median background from each dither. A notebook is provided to generate median backgrounds for the MIRI imager, with applications for other issues as described in the "Summary of Common Issues and Workarounds" section below.
Figure 4. Example of MIRI imager persistence.
Click on the figure for a larger view.
Example of persistence (vertical dark lines and horizontal trail off the lefthand side) in program 6122, observation 4. The prior MIRI observation used the slitless prism, resulting in persistence from the dispersed spectrum of a bright star during an intervening observation with another instrument before the MIRI imager was used again.
Imager knife edge
The MIRI imager has a protrusion from a knife edge structure that blocks a small portion of the field of view (FOV) on the left side, and is used for optical testing. The main effect will be on mosaics (see Knife Edge Gap in MIRI Imaging Mosaics). The default MIRI imaging mosaic overlap of 10% is used to address the gap.
Bonus Lyot FOV in imaging
In most cases, the Lyot FOV provides valid, calibrated data except where the Lyot occulting spot and support structure prevent light from reaching the detector.
However, there have been some datasets that show an offset between background levels in the Lyot compared to those in the rest of the imager. While the differences are not typically large, in those cases, they can be seen by eye in individual calibrated images, and can make background matching for larger mosaics that include both imager and Lyot regions more difficult.
Figure 5. F2550W image with differing background levels in the Lyot and Imager FOV.
Click on the figure for a larger view.
An F2550W image that shows different background levels in the Lyot vs. the rest of the imager. This image is a calibrated file with the F2550W filter. The background levels in the imager portion are around 850–860 MJ/str while the Lyot has background levels of around 870–880 MJ/str.
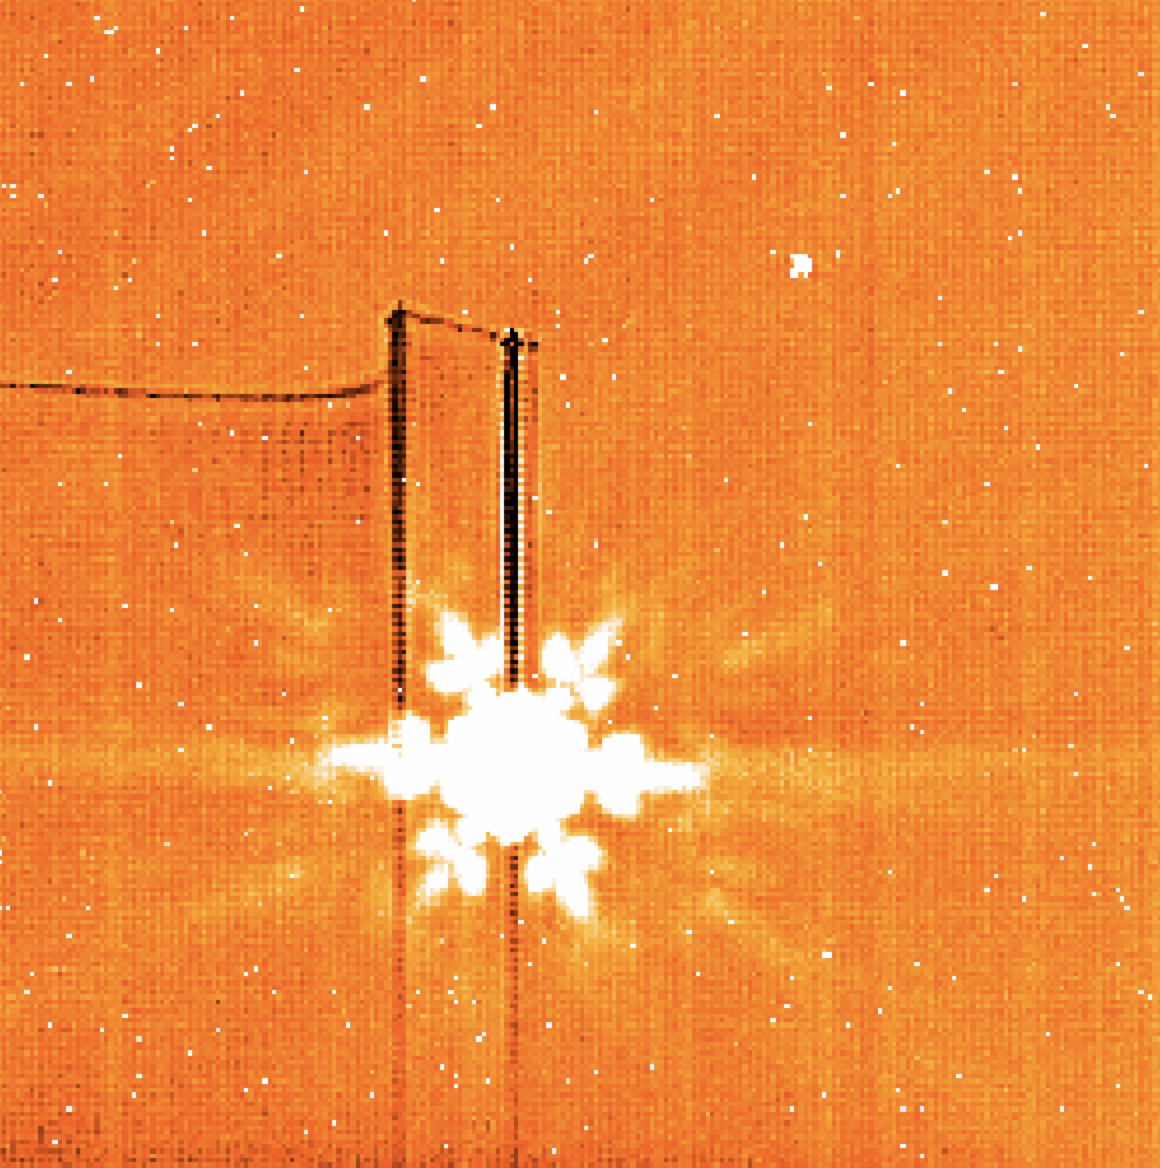
Edge brightening
The in-flight imaging FOV exhibits some stray light features on the left and bottom edges (Figure 6). These should not have a significant impact on combined dithered or mosaicked imaging. Additional analysis is underway.
Figure 6. Edge brightening in the MIRI imager field of view, also showing scattered light features in the MIRI coronagraphs
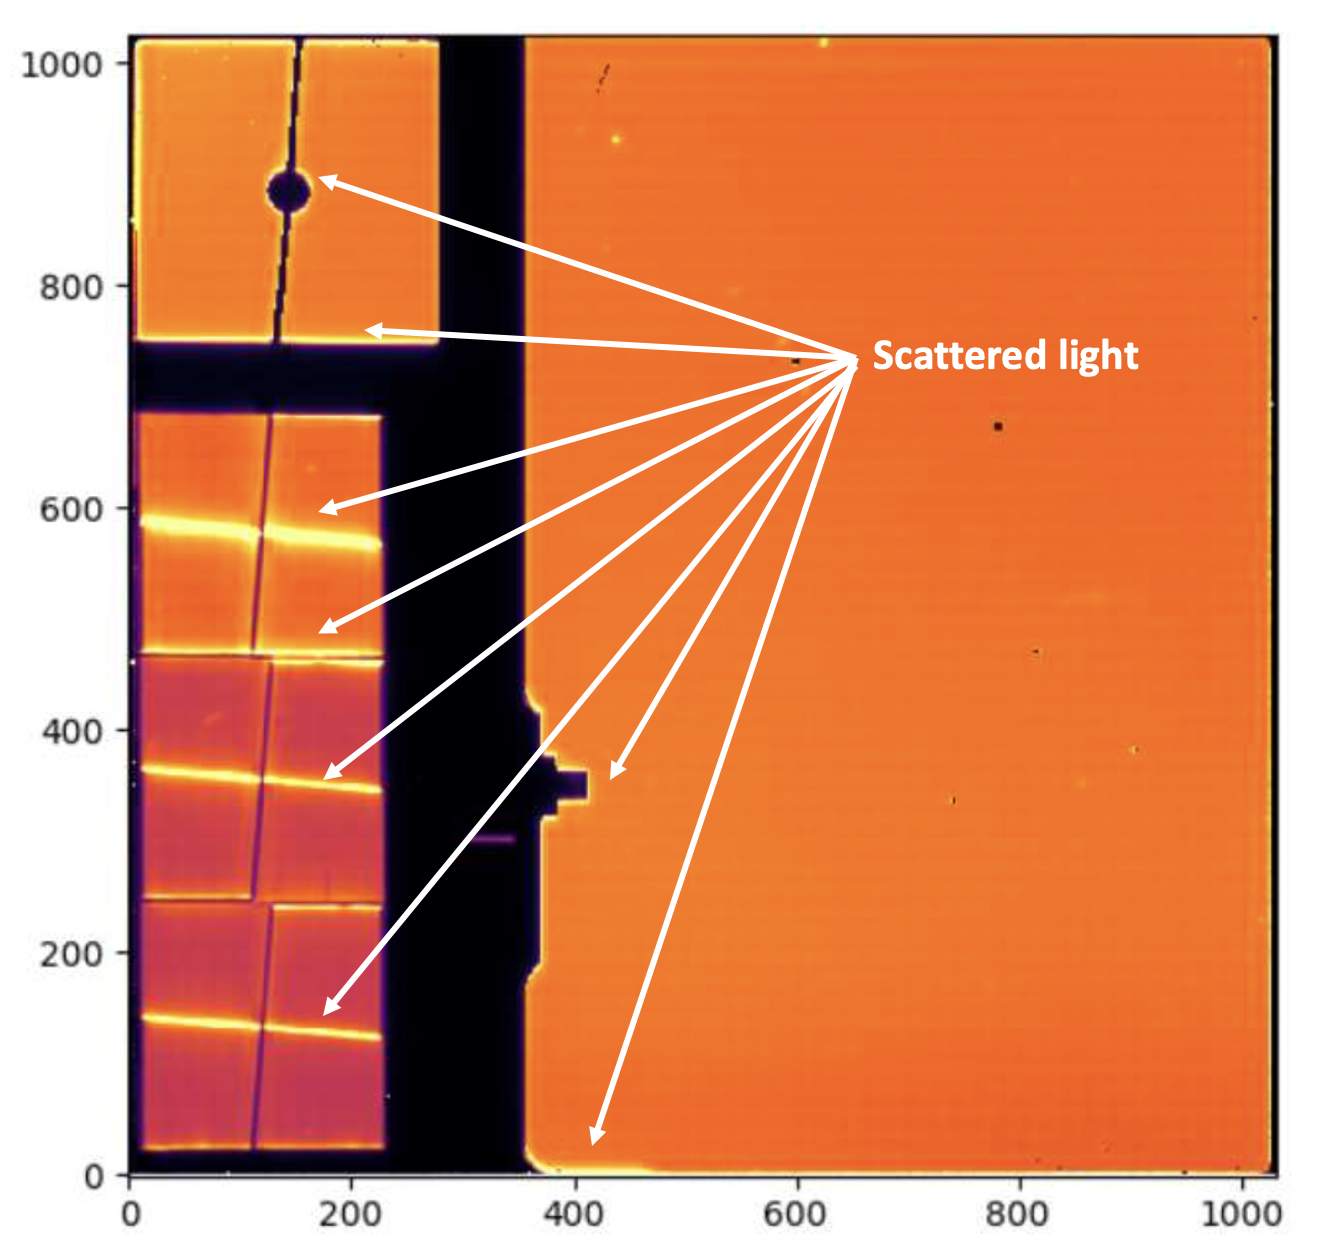
Click on the figure for a larger view.
An in-orbit engineering F1500W image of a sparse astronomical field. Brightening around the lower edge of the imaging FOV and the knife edge are visible. Scattered light features in the coronagraphs are also evident.
Calibration issues
Time-dependent count rate loss
See MIRI Imaging Calibration Status.
FGS-MIRI alignment
The astrometric alignment between the FGS (FGS1 and FGS2) and MIRI focal planes has been found to have a small systematic offset in the V3 axis, of around 0.15"–0.2" (approx. 1–2 pixels). This can result in offsets of ~0.1"–0.2" in RA, Dec in the observation (due to the angle between the V2V3 and sky coordinate systems) both in the initial blind pointing of the telescope, and subsequently the WCS assigned to the exposures by the pipeline. For full frame imaging this is unlikely to have a significant impact on the science quality of the data; for observations with the smallest subarray (SUB64), users should take this offset into consideration. Users who require high precision target placement are advised to use the target acquisition sequence, which (with the exception of the initial slew) is independent of FGS-MIRI alignment.
Pipeline notes
Cosmic ray showers
The JWST Science Calibration Pipeline correction for cosmic ray shower artifacts in MIRI (see Shower and Snowball Artifacts) is known to excessively flag pixels unrelated to cosmic rays in long-wavelength MIRI imaging data. As such, the default pipeline currently does not apply this correction to MIRI imaging in the F1800W, F2100W, or F2550W filters.
Overflagging of pixels by outlier_detection step in calwebb_image3
Combined level 3 imaging mosaics may sometimes have gaps (large blocks of NaN-valued pixels) or doubled sources. This is often caused by uncertainties in guide star coordinates used for individual mosaic tiles, producing an incorrect world coordinate solution for such tiles. The corresponding discrepancies in the overlap regions between tiles can then cause the outlier detection routine to flag excessively large areas since spatial structures do not line up properly between tiles. This can be particularly noticeable for regions with extensive extended emission structure and few bright point sources, as there are fewer obvious reference points that the automated alignment software can use to fix any coordinate errors.
How to diagnose the underlying causes of overflagging:
- The simplest way to check for misalignment of images is to run calwebb_image3 on all of your data with the outlier_detection step skipped (turned off). If your output combined image shows doubled sources, then there is a misalignment.
- If you want to dig a little deeper into the data, you can run calwebb_image3 on your data with default settings to obtain the ".crf" files that are output as an intermediate file. Examine the ".crf" files to see deeper indications of the cause. Look at the DQ array of these files and determine if there are large sections or the centers of your sources that are flagged with the value 16 (OUTLIER) as well as the value 1 (DO_NOT_USE). If there are large sections of an image or if all of the sources are being flagged, this could be indications that an exposure or a tile of a mosaic is not aligned properly with the others. Look through all of the ".crf" files that were combined and determine if the sources are at the same coordinates in each dither/tile.
If there is no visible misalignment, then you might be able to get better results (less over-flagging) by changing the parameters of the outlier_detection step of the pipeline. Changing the snr and scale parameters might allow you to obtain better results.
If you do see visible shifts between sources in your data, then the easiest thing to do is to measure the difference in RA and Dec in the discrepant mosaic tiles and update the pointing information (stored in the RA_REF and the DEC_REF keywords of the "rate" file FITS headers) accordingly. Then you can finish processing your data through the remainder of the pipeline and you should get a better alignment and fewer bad pixels flagged due to a misalignment of the data.
A short Python script to update the wcs headers is shown here:
from astropy.io import fits
import numpy as np
filelist = [‘list of files that have bad wcs’]
goodra = goodraval  # This is the RA your source should be aligned to
badra = badraval  # This is the RA of your mis-aligned source
gooddec = gooddecval  # This is the DEC your source should be aligned to
baddec = baddecval  # This is the DEC of your mis-aligned source

# Calculate differences in RA and Dec
dra = goodra - badra
ddec = gooddec - baddec

for file in filelist:
    newfile=file.replace('rate','ratefix')
    hdu=fits.open(file)
    scihdr=hdu[1].header
    scihdr['RA_REF'] = scihdr['RA_REF'] + dra
    scihdr['DEC_REF'] = scihdr['DEC_REF'] + ddec
    hdu[1].header=scihdr
    hdu.writeto(newfile,overwrite=True)
Note that "rate" files edited in this way must be rerun through the calwebb_image2 pipeline in order to incorporate the shifted keywords into the embedded WCS.
Summary of common issues and workarounds
The sections above provide detail on each of the known issues affecting MIRI Imaging data; in this table we summarize some of the most likely issues for users to encounter along with any workarounds if available. Note that greyed-out issues have been retired, and are fixed as of the indicated pipeline build.
| Symptoms | Cause | Workaround | Fix build | Mitigation Plan |
|---|---|---|---|---|
MR-I02: The "cal" data product has "tree ring"-like or striping patterns. | The "tree ring" pattern of curves in MIRI images, as well as column striping, are residual detector effects that are not removed in all cases by the reference files. | Creating and subtracting a median background, from a dedicated background observations, or from the science data directly, can remove residual detector patterns in the background. This notebook demonstrates how it can be done. | N/A | Created issue Reference file and pipeline updates may be available at a future date to remove residual patterns such as the "tree rings" from all data, but there is no timeline on when this might be accomplished. |
MR-I01: Image has residual background. | The backgrounds for longer wavelength images can be quite high, and difficult to work with if dedicated background images are not taken and subtracted off in the pipeline. | Users can create a median sky (background image) and subtract it off for themselves if there is no extended source such as a galaxy or nebula in the image. This is most useful for long wavelength imaging, but can also be used for shorter wavelength images. This notebook demonstrates how it can be done. | N/A | Created issue This is not something that can (or should) be changed in the pipeline, and will need to be done as an offline step as shown in the notebook. |