Resampling Artifacts
Data artifacts due to resampling noise can impact NIRSpec and MIRI MRS IFU data cubes, appearing as variable-frequency oscillations in the spectra of single spaxels. This article describes the methods available to correct for these artifacts.
On this page
Background
As discussed in NIRSpec Dithers and Nods and MIRI MRS PSF and Dithering, both the NIRSpec and MIRI MRS IFUs are spatially undersampled. The PSF delivered by the JWST optics is sufficiently small that it is not Nyquist-sampled by the image slicing optics and detector pixels of the IFUs. As a result, when the pipeline cube building software resamples the native detector pixel data into a regular cube grid power can be aliased to lower spatial frequencies in the vicinity of unresolved point sources. Extended sources are largely unaffected as the relevant spatial scales are well sampled.
This issue is explored in detail by Law et al. 2023 and the basic concept is illustrated in Figure 1 below for a simplified 1-D case. In brief, when the signal is not Nyquist sampled it is not possible to determine the peak of the signal via interpolation from the observed data points. The peak of the resampled signal will vary depending on whether the emission was centered within a pixel or between pixels, giving rise to an oscillatory signal in the reconstructed intensity whose frequency varies with wavelength according to the angle at which the source centroid crosses the detector pixel grid.
Figure 1. Illustration of resampling noise in 1-D
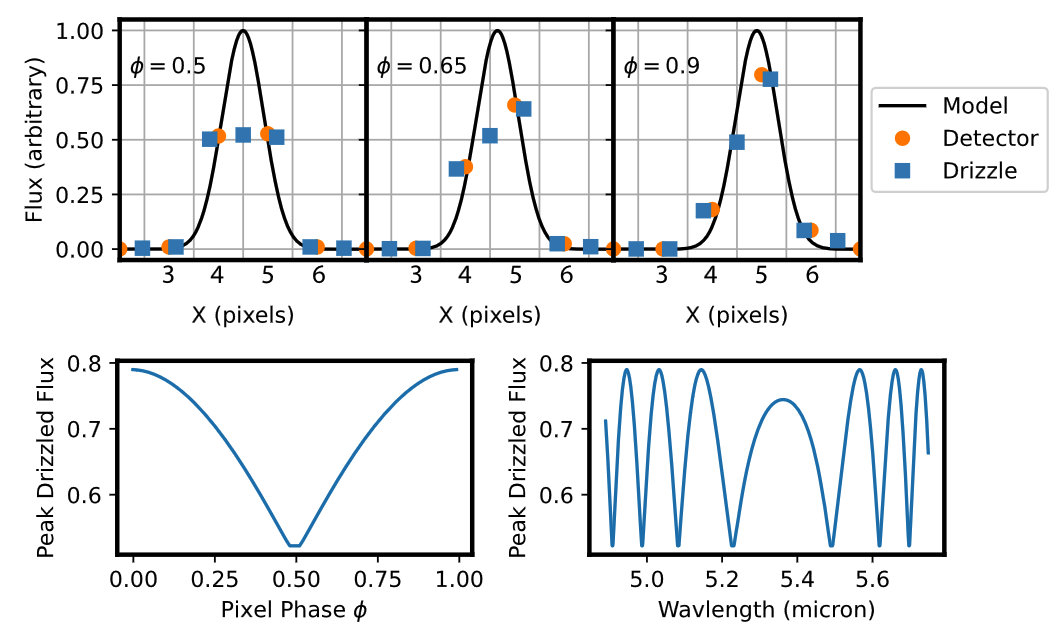
Click on the figure for a larger view.
One-dimensional illustration of the origins of resampling noise. The top panel shows three realizations of a 1-D Gaussian line profile with different peak locations. Orange circles represent the values recorded after convolution of the line profile with the tophat pixel boundaries (indicated by the vertical grid lines), and the blue squares indicate the values after interpolating to a different sampling scale. In each case, φ gives the pixel phase of the Gaussian peak. Bottom-left panel: peak interpolated flux value as a function of the pixel phase of the Gaussian peak. Bottom-right panel: peak interpolated flux as a function of wavelength assuming a pixel phase that varies with wavelength in a manner similar to a typical MRS spectral trace (Figure credit: Law et al. 2023)
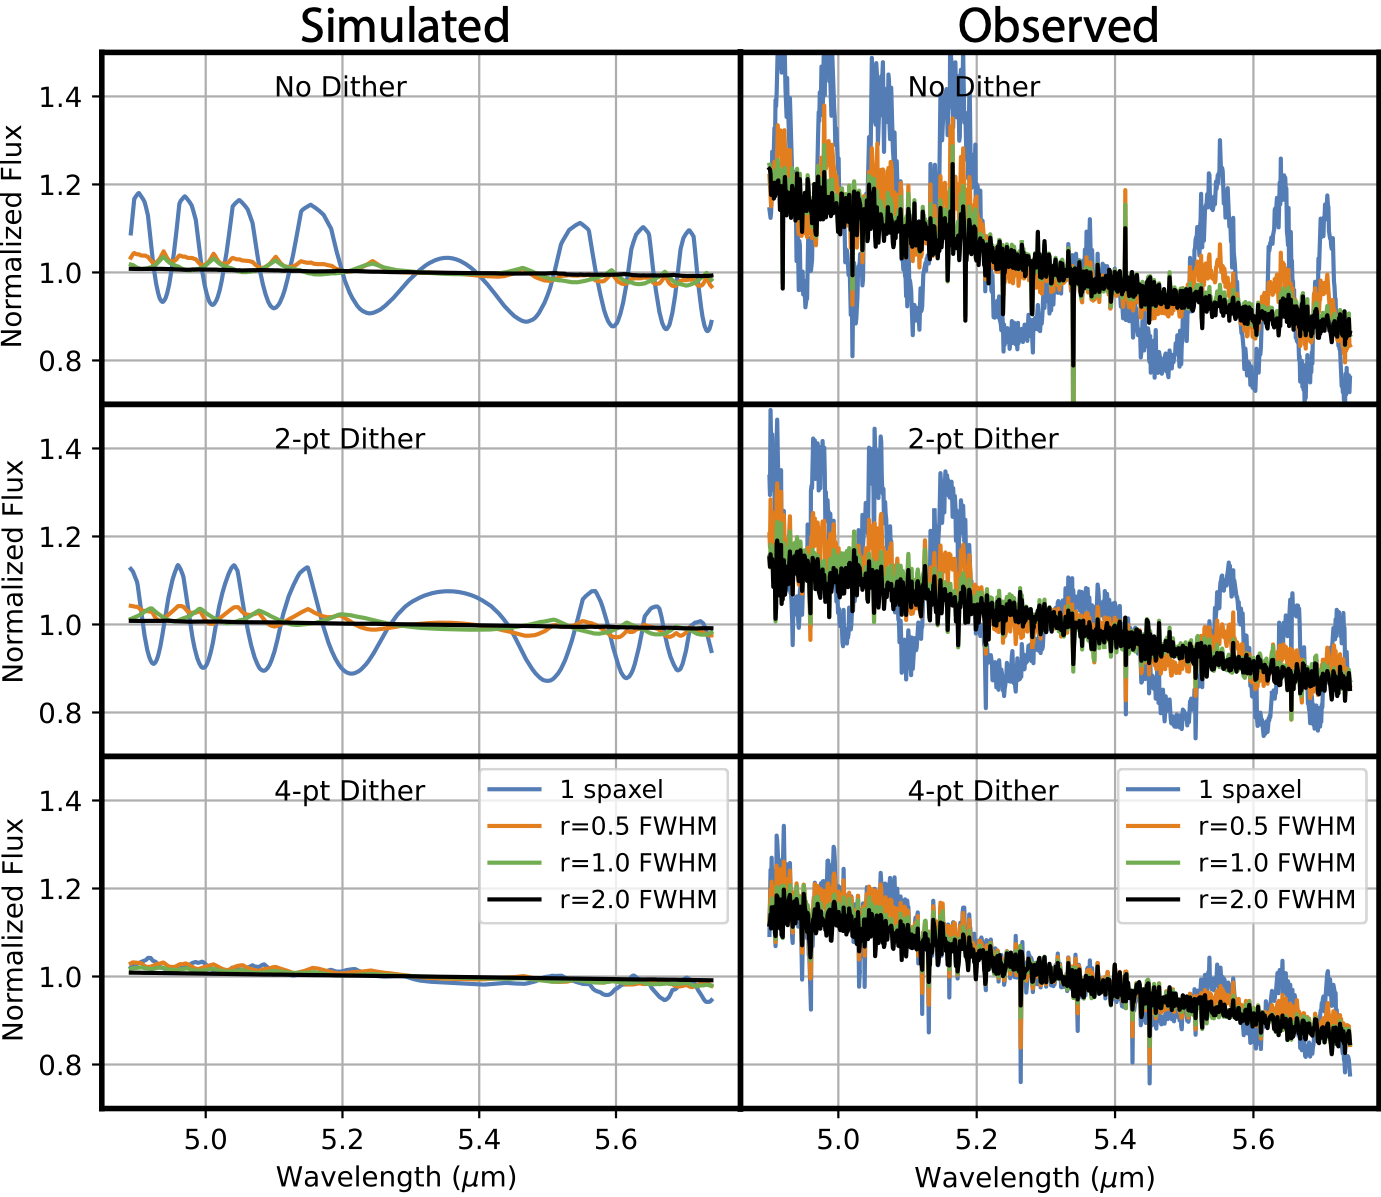
In practice, this effect manifests for science data as oscillations in the spectra of individual cube spaxels, or spatial regions that are small compared to the PSF. Figure 2 shows the theoretically expected resampling artifacts for MIRI MRS channel 1A based on a model of the JWST PSF and MIRI MRS detector sampling; these are similar to actual artifacts observed in the spectra of bright point sources with data obtained during Cycle 1. In both simulated and observed cases, the resampling noise is significantly reduced by obtaining data using a 4-point dither pattern designed to properly sample the JWST PSF. Even for a 4-point dither pattern however, few-percent artifacts remain if attempting to plot the spectra of individual spaxels from the data cubes. Essentially, doing so is akin to a 2-D case of comparing the brightness of multiple stars throughout an undersampled image by looking only at the brightest central pixel values.
As illustrated by Figure 2, the simplest method of avoiding resampling noise is to extract spectra from the IFU data cubes using apertures comparable in size to the PSF FWHM. The oscillations present in individual spaxels cancel each other out for such large apertures, reducing the amplitude of the artifacts to well below 1% and ensuring flux conservation in an integrated sense.
Figure 2. Resampling noise in MRS spectra
Click on the figure for a larger view.
Left panels: Numerical model of expected artifacts in MIRI MRS channel 1A data for undithered, 2-pt dither, and 4-pt dithered data of an intrinsically constant-valued spectrum. Spectra have been extracted using apertures of various sizes ranging from single-spaxel spectra to apertures with radii twice the PSF FWHM. Right panels: Observed resampling noise in observations of G3V standard star 16 CygB. The overall tilt in the 16 CygB spectrum is due to the intrinsic spectral shape of the star. (Figure credit: Law et al. 2023)
Adaptive Trace Model correction method
An optional pipeline step to greatly reduce resampling noise in IFU data cubes was introduced in Build 12.3 (jwst pipeline version 2.0.0). The adaptive_trace_model step (see ReadTheDocs) is described in detail by Law & Clarke 2026.
This method breaks the degeneracy of the subpixel information in each wavelength slice using the assumption that the source centroid (in RA/Dec.) and spatial profile are constant or vary only slowly with wavelength. Using the pixel phase information provided by different wavelengths it is therefore possible to construct an oversampled spline model of the spatial profile of each IFU slice. This spline model can then be used to oversample the native detector pixel data, and these oversampled pixels can then be used to construct the final data cubes using the standard 3-D drizzle approach.
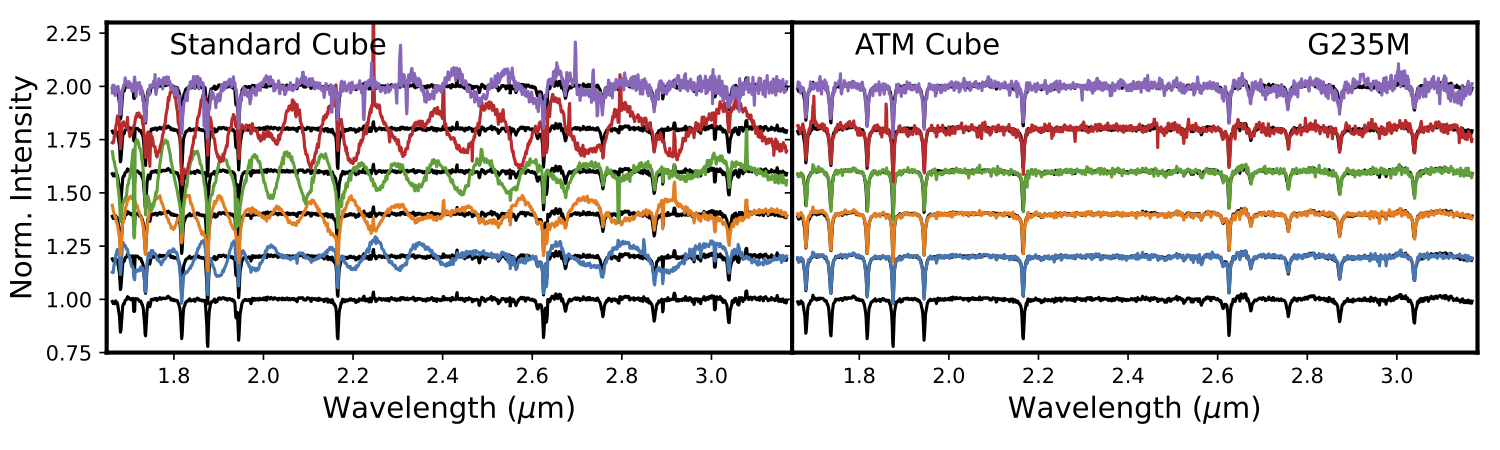
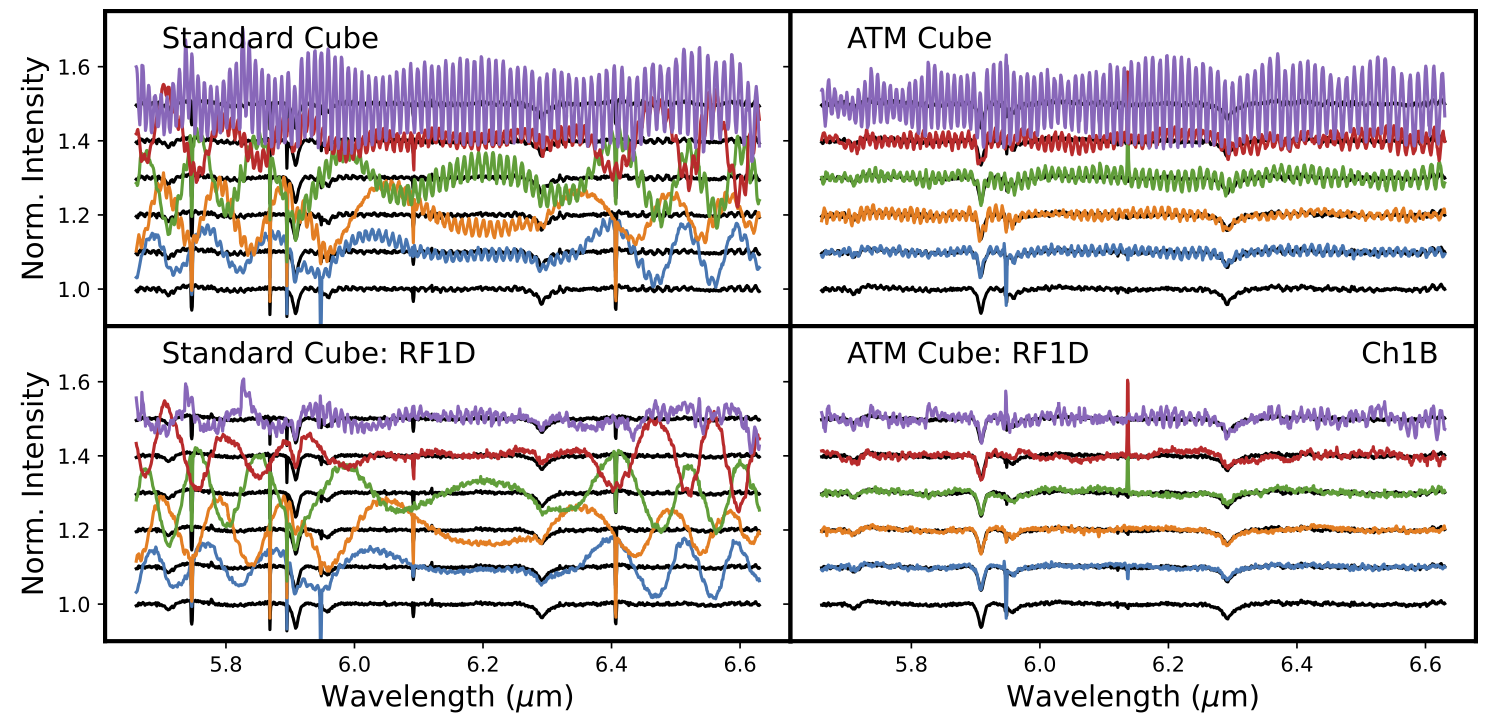
Figures 3 and 4 below show the typical performance of this step when applied to point source observations obtained with the NIRSpec and MIRI MRS IFUs. In the NIRSpec case the oscillatory artifacts present in individual-spaxel spectra are almost entirely removed, making it much easier to distinguish genuine spectral features. In the MIRI case residual fringing artifacts beat against the resampling artifacts resulting in a significantly more complex oscillation. Nonetheless, the combined application of the adaptive trace model and residual fringe techniques result in a substantial improvement to the scientific utility of the per-spaxel spectra.
The assumption of a slowly-varying spatial profile can break down for complex scenes such as those with multiple point sources and nebular emission from extended regions. Nonetheless, additional correction techniques in the adaptive_trace_model step have been proven to work well for multiple science cases as complex as lensed galaxies, AGN, and the Milky Way galactic center (see discussion by Law & Clarke 2026). The step may, however, require adjustment of some default parameters for such complex scenes, such as decreasing the flux threshold necessary for computing a spline model or adjusting the range in which the spline models are used. Additional details about the configurable step arguments and algorithm are given in ReadTheDocs.
Since this correction relies on modeling and interpolating the astronomical scene it may not be appropriate for all scientific use cases and is thus not used by the default JWST pipeline data products available on MAST. Users interested in applying it to their own data should reprocess their data using the JWST calibration pipeline (see, e.g., the JWST Pipeline Notebooks) with calwebb_spec3.adaptive_trace_model.skip = False. Caution is recommended when interpreting the results; any feedback and questions can be directed to the JWST help desk.
Figure 3. Correction of resampling noise in NIRSpec IFU data using the adaptive trace model step
Click on the figure for a larger view.
Resampling noise in standard (left-hand panel) and adaptive trace model (ATM) oversampled data cubes (right-hand panel) for single-spaxel spectra extracted from observations of standard star J1743045 (spectral type A5 IIIm) using the NIRSpec G235M/F170LP configuration. The solid black lines represent the aperture-integrated spectra, while colored lines represent single-spaxel spectra extracted from the first, second, 4th, 8th, and 16th brightest spaxels (blue through purple respectively). Aperture-integrated spectra have been underplotted beneath all single-spaxel spectra to aid comparisons. All spectra have been normalized by a low-order polynomial fit to the spectrum and arbitrarily offset vertically for clarity. Narrow features due to hydrogen absorption in the stellar spectrum are most noticeable in composite (black lines) and ATM-corrected spectra. (Figure credit: Law et al. 2026)
Figure 4. Correction of resampling noise in MIRI MRS data using the adaptive trace model step
Click on the figure for a larger view.
Resampling noise in standard (left-hand panels) and adaptive trace model (ATM) oversampled data cubes (right-hand panels) for single-spaxel spectra extracted from observations of standard star HD2811 (spectral type A3 V) using the MIRI MRS channel 1A configuration. The solid black lines represent the aperture-integrated spectra, while colored lines represent single-spaxel spectra extracted from the first, second, 4th, 8th, and 16th brightest spaxels (blue through purple respectively). Aperture-integrated spectra have been underplotted beneath all single-spaxel spectra to aid comparisons. All spectra have been normalized by a low-order polynomial fit to the spectrum and arbitrarily offset vertically for clarity. Narrow features due to hydrogen absorption in the stellar spectrum are most noticeable in composite (black lines) and ATM-corrected spectra. The bottom row shows spectra that have had residual fringes removed by the RF1D correction algorithm. (Figure credit: Law et al. 2026)
References
Law, D. R., et al. 2023, AJ, 166, 45 (MRS Cube Building)
A 3D Drizzle Algorithm for JWST and Practical Application to the MIRI Medium Resolution Spectrometer
Law, D. R. and Clarke, M. 2026, AJ, 171, 304 (Adaptive Trace Model)
Mitigating Resampling Artifacts for the JWST IFU Spectrometers with Adaptive Trace Modeling