NIRCam Imaging
JWST NIRCam imaging is obtained at 0.6–2.3 μm (0.031 "/pix) and 2.4–5.0 μm (0.063 "/pix) simultaneously over a 9.7 arcmin² field of view.
On this page
See also: NIRCam Imaging APT Template
Imaging is one of NIRCam's observing modes, which also include time-series imaging (rapid monitoring of bright variable sources) and coronagraphy (high-contrast imaging).
For standard imaging discussed here, NIRCam observes a 9.7 arcmin² field of view simultaneously in a short wavelength channel (0.6–2.3 µm) and long wavelength channel (2.4–5.0 µm) via a beam splitting dichroic. Extra-wide, wide, medium, and narrow filters are available.
When creating a NIRCam imaging observation with the Astronomer's Proposal Tool (APT), the primary options are the filter, dither pattern, subarray, and exposure time (via the detector readout patterns). One filter is selected for each wavelength channel.
The Exposure Time Calculator (ETC) allows users to determine the observing parameters required for their science goals.
Table 1. Properties of NIRCam short and long wavelength channels
| Short wavelength channel | Long wavelength channel | |
|---|---|---|
| Wavelength range | 0.6–2.3 μm | 2.4–5.0 μm |
| Nyquist wavelength† | 2.0 μm | 4.0 μm |
| Fields of view | 2 × 2.2′ × 2.2′ (with 4"–5” gaps) | 2 × 2.2′ × 2.2′ |
| Imaging pixels | 8 × 2040 × 2040 pixels | 2 × 2040 × 2040 pixels |
| Pixel scale | 0.031 ″/pixel | 0.063 ″/pixel |
† PSF FWHM ~ 2 pixels; undersampled at shorter wavelengths
Field of view
NIRCam's 2 modules operate in parallel to observe a 9.7 arcmin² field of view consisting of two 2.2' × 2.2' fields separated by a ~44" gap. Gaps of ~5" also separate the 4 detectors in each short wavelength module. If full field imaging is not required, individual modules or smaller subarrays may be used to increase readout speeds and reduce data volumes. To cover larger areas, mosaics are best obtained in combination with primary dithers.
Filters
Twenty-nine NIRCam filters are available for imaging. They are classified as extra-wide (R ~ 1), wide (R ~ 4), medium (R ~ 10), and narrow (R ~ 100). One filter is selected for each wavelength channel (one short wavelength & one long wavelength filter), and both channels are observed simultaneously.
MultiExcerpt named filter plot was not found -- Please check the page name and MultiExcerpt name used in the MultiExcerpt-Include macro
Dithering and mosaics
Words in bold are GUI menus/
panels or data software packages;
bold italics are buttons in GUI
tools or package parameters.
Mosaics are used to image regions of sky larger than the NIRCam field of view. A mosaic consists of a grid of N × M telescope pointings. Large NIRCam mosaics are best combined with a FULL primary dither pattern.
Subarrays
If the full NIRCam field of view is not required for science, smaller subarrays may be read out from the detectors. Faster readout times for subarrays allow brighter objects to be observed in shorter exposures, avoiding saturation. Subarrays also deliver lower data volumes than full detector readouts. Users interested in rapid cadence monitoring of bright, time-variable sources should refer to the time-series imaging observing mode.
Exposure time
NIRCam's exposure time is governed by detector readout patterns.
Note that due to gaps between the detectors, dithered images will have uneven total exposure times (with depth varying across the image).
The Exposure Time Calculator (ETC) allows users to determine the exposure time required to achieve their science goals.
Sensitivity
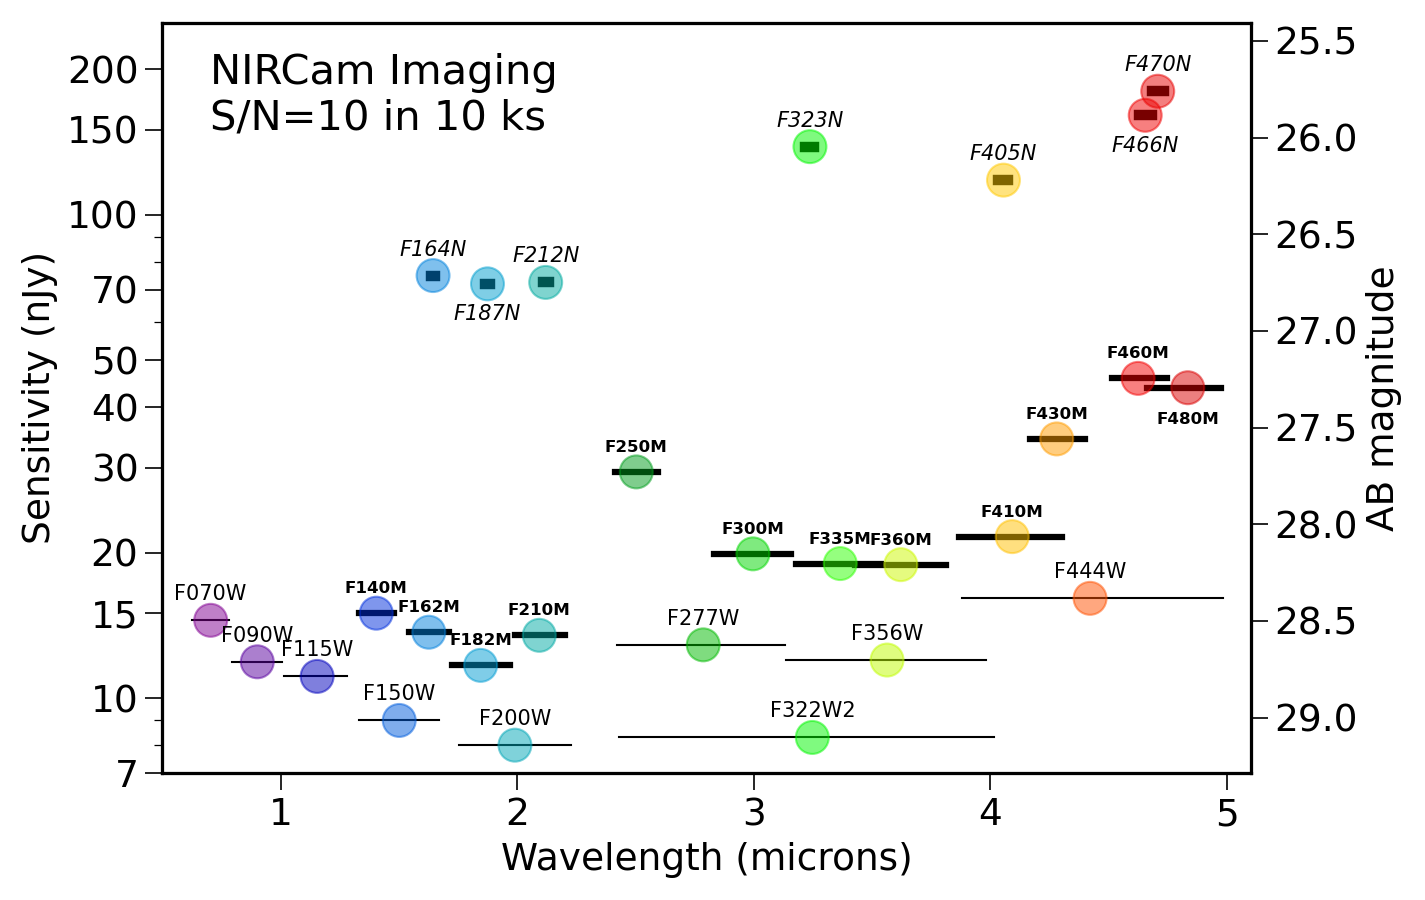
The following sensitivity and saturation estimates are provided as a rough guide. Please use the Exposure Time Calculator (ETC) for your proposed observations.
NIRCam is capable of detecting very faint sources in imaging mode. Typical 10 ks images in F200W and F322W2 may yield S/N = 10 detections of AB mag 29 (~9 nJy) point sources (and S/N = 5 detections of AB mag 29.75 [4.5 nJy] sources).
Saturation
Moderately bright sources (solar type, K-band Vega mag 14–17) will saturate the NIRCam detectors in full field broadband imaging. Narrower filters enable brighter saturation limits, as shown below. The smallest available subarray (64 × 64 pixels) brightens these limits by 6 magnitudes. The brightest objects are best studied using the NIRCam time-series observing modes, which allow the use of weak lenses (at short wavelengths) and grisms (at long wavelengths) to spread the light over more pixels.
References
University of Arizona NIRCam website


