MIRI Point Spread Functions
Simulated JWST MIRI imaging point spread functions (PSFs) in each filter and disperser and predicted values for the full width at half maximum (FWHM), radial profiles, and encircled energy curves can be found using STPSF (formerly WebbPSF).
On this page
At wavelengths λ > 2 μm, JWST obtains diffraction-limited imaging with a Strehl ratio = 0.8 and PSF full width at half maximum (FWHM) of ~λ/D radians (JWST's D = 6.5-m mirror). The MIRI detectors achieve Nyquist sampling or better (FWHM > 2 pixels) above ~7 µm. Below these wavelengths, the PSF is undersampled. PSF sampling may be improved by performing dithers between exposures.
On-sky MIRI imager PSFs
This section presents the MIRI imager PSFs as measured from calibration sources used in JWST Absolute Flux Calibration and as described in Gordon et al. (2025). The PSFs are demonstrated in Figure 1 using an A-dwarf standard star BD+60 1753 (see also Rigby et al. (2023) for analysis of the MIRI PSFs done during commissioning).
MIRI observations of BD+60 1753 in the 9 imaging filters showing the MIRI imaging PSFs. Data reduction was carried out as described in Gordon et al. (2025). Cutouts are 7” (~64 native pixels) on a side. Note: The F560W PSF is undersampled and the additional structure in the F560W and F770W PSFs is the cruciform artifact.
Radial and encircled energy profiles
Figure 2 shows the radial (left panels) and encircled energy (EE; right panels) profiles of the MIRI imager PSFs. Encircled energies were constructed by combining observations of BD+60 1753 (PIDs 1027, 1536, 1539, 4499) in the inner radii with models of the PSF wings from STPSF (see Gordon et al. (2025) for details). This approach allows the EE profiles to be normalized to unity at infinity, which provides robust aperture corrections. The EE is averaged over multiple observations for each filter in the figure below. The radial profiles were constructed from the average EE profiles and normalized to unity in the center.
Click on the figure for a larger view.
For each MIRI imaging filter, the radial (left) and encircled energy (right) profiles are shown (green, solid line), constructed by combining observations of BD+60 1753 in the inner radii with STPSF models for the outer radii. The point where observations and models were joined are marked (dotted gray line). The STPSF model is shown at all radii (orange dot dash line) for reference. Note: strong variations in the background of the F2550W observations prevented measuring a high quality observed PSF, so the radial and encircled energy profiles are from STPSF.
Imager PSF FWHMs
Figure 3 shows the FWHM of the MIRI imaging filters as a function of each filter’s average wavelength, derived from the radial profiles for BD+60 1753 (Figure 2). Numerical values for each FWHM, in units of arcsec and pixel, are reported in Table 1. Note: the F560W and F770W FWHMs are broadened due to the presence of the cruciform artifact and being under-sampled.
This figure shows the FWHM measured from the radial profiles of BD+60 1753 (Figure 2). The values are listed in Table 1.
Table 1. FWHM values for each PSF, from Figure 3
| Filter | Wavelength (μm) | PSF FWHM (arcsec) | PSF FWHM (pixel) |
|---|---|---|---|
| F560W | 5.589 | 0.269 | 2.44 |
| F770W | 7.528 | 0.301 | 2.74 |
| F1000W | 9.883 | 0.356 | 3.24 |
| F1130W | 11.298 | 0.390 | 3.54 |
| F1280W | 12.712 | 0.430 | 3.91 |
| F1500W | 14.932 | 0.506 | 4.60 |
| F1800W | 17.875 | 0.595 | 5.41 |
| F2100W | 20.563 | 0.685 | 6.22 |
| F2550W | 25.147 | 0.830 | 7.36 |
Imager PSF metrics
Table 2 summarizes basic measurements of PSF metrics made with the observed BD+60 1753 PSFs and the STPSF models. The results show that the objective of “>56% of the total PSF flux contained within the first dark Airy ring” is met for all filters.
Table 2. Basic PSF metrics for all MIRI bands using in-flight data (left) and STPSF models (center)
The comparison between in-flight data and STPSF is presented in the right columns.
| In-Flight Data | STPSF | Data / STPSF | ||||
|---|---|---|---|---|---|---|
| Filter | FWHM (arcsec) | EE within the first Airy ring | FWHM (arcsec) | EE within the first Airy ring | FWHM (ratio) | EE (ratio) |
| F560W | 0.269 | 64 % | 0.180 | 60.0 % | 1.5 | 1.07 |
| F770W | 0.301 | 65 % | 0.242 | 63.4 % | 1.2 | 1.02 |
| F1000W | 0.356 | 68 % | 0.320 | 68.4 % | 1.1 | 0.99 |
| F1130W | 0.390 | 69 % | 0.368 | 69.7 % | 1.06 | 0.99 |
| F1280W | 0.430 | 70 % | 0.411 | 69.6 % | 1.05 | 1.01 |
| F1500W | 0.506 | 70 % | 0.483 | 70.0 % | 1.06 | 1.00 |
| F1800W | 0.595 | 71 % | 0.580 | 70.0 % | 1.03 | 1.01 |
| F2100W | 0.685 | 70 % | 0.664 | 70.0 % | 1.03 | 1.00 |
| F2550W | 0.830 | 70 % | 0.814 | 70.0 % | 1.02 | 1.00 |
On-sky MIRI coronagraphic imaging PSFs
See also: MIRI Coronagraphic Imaging
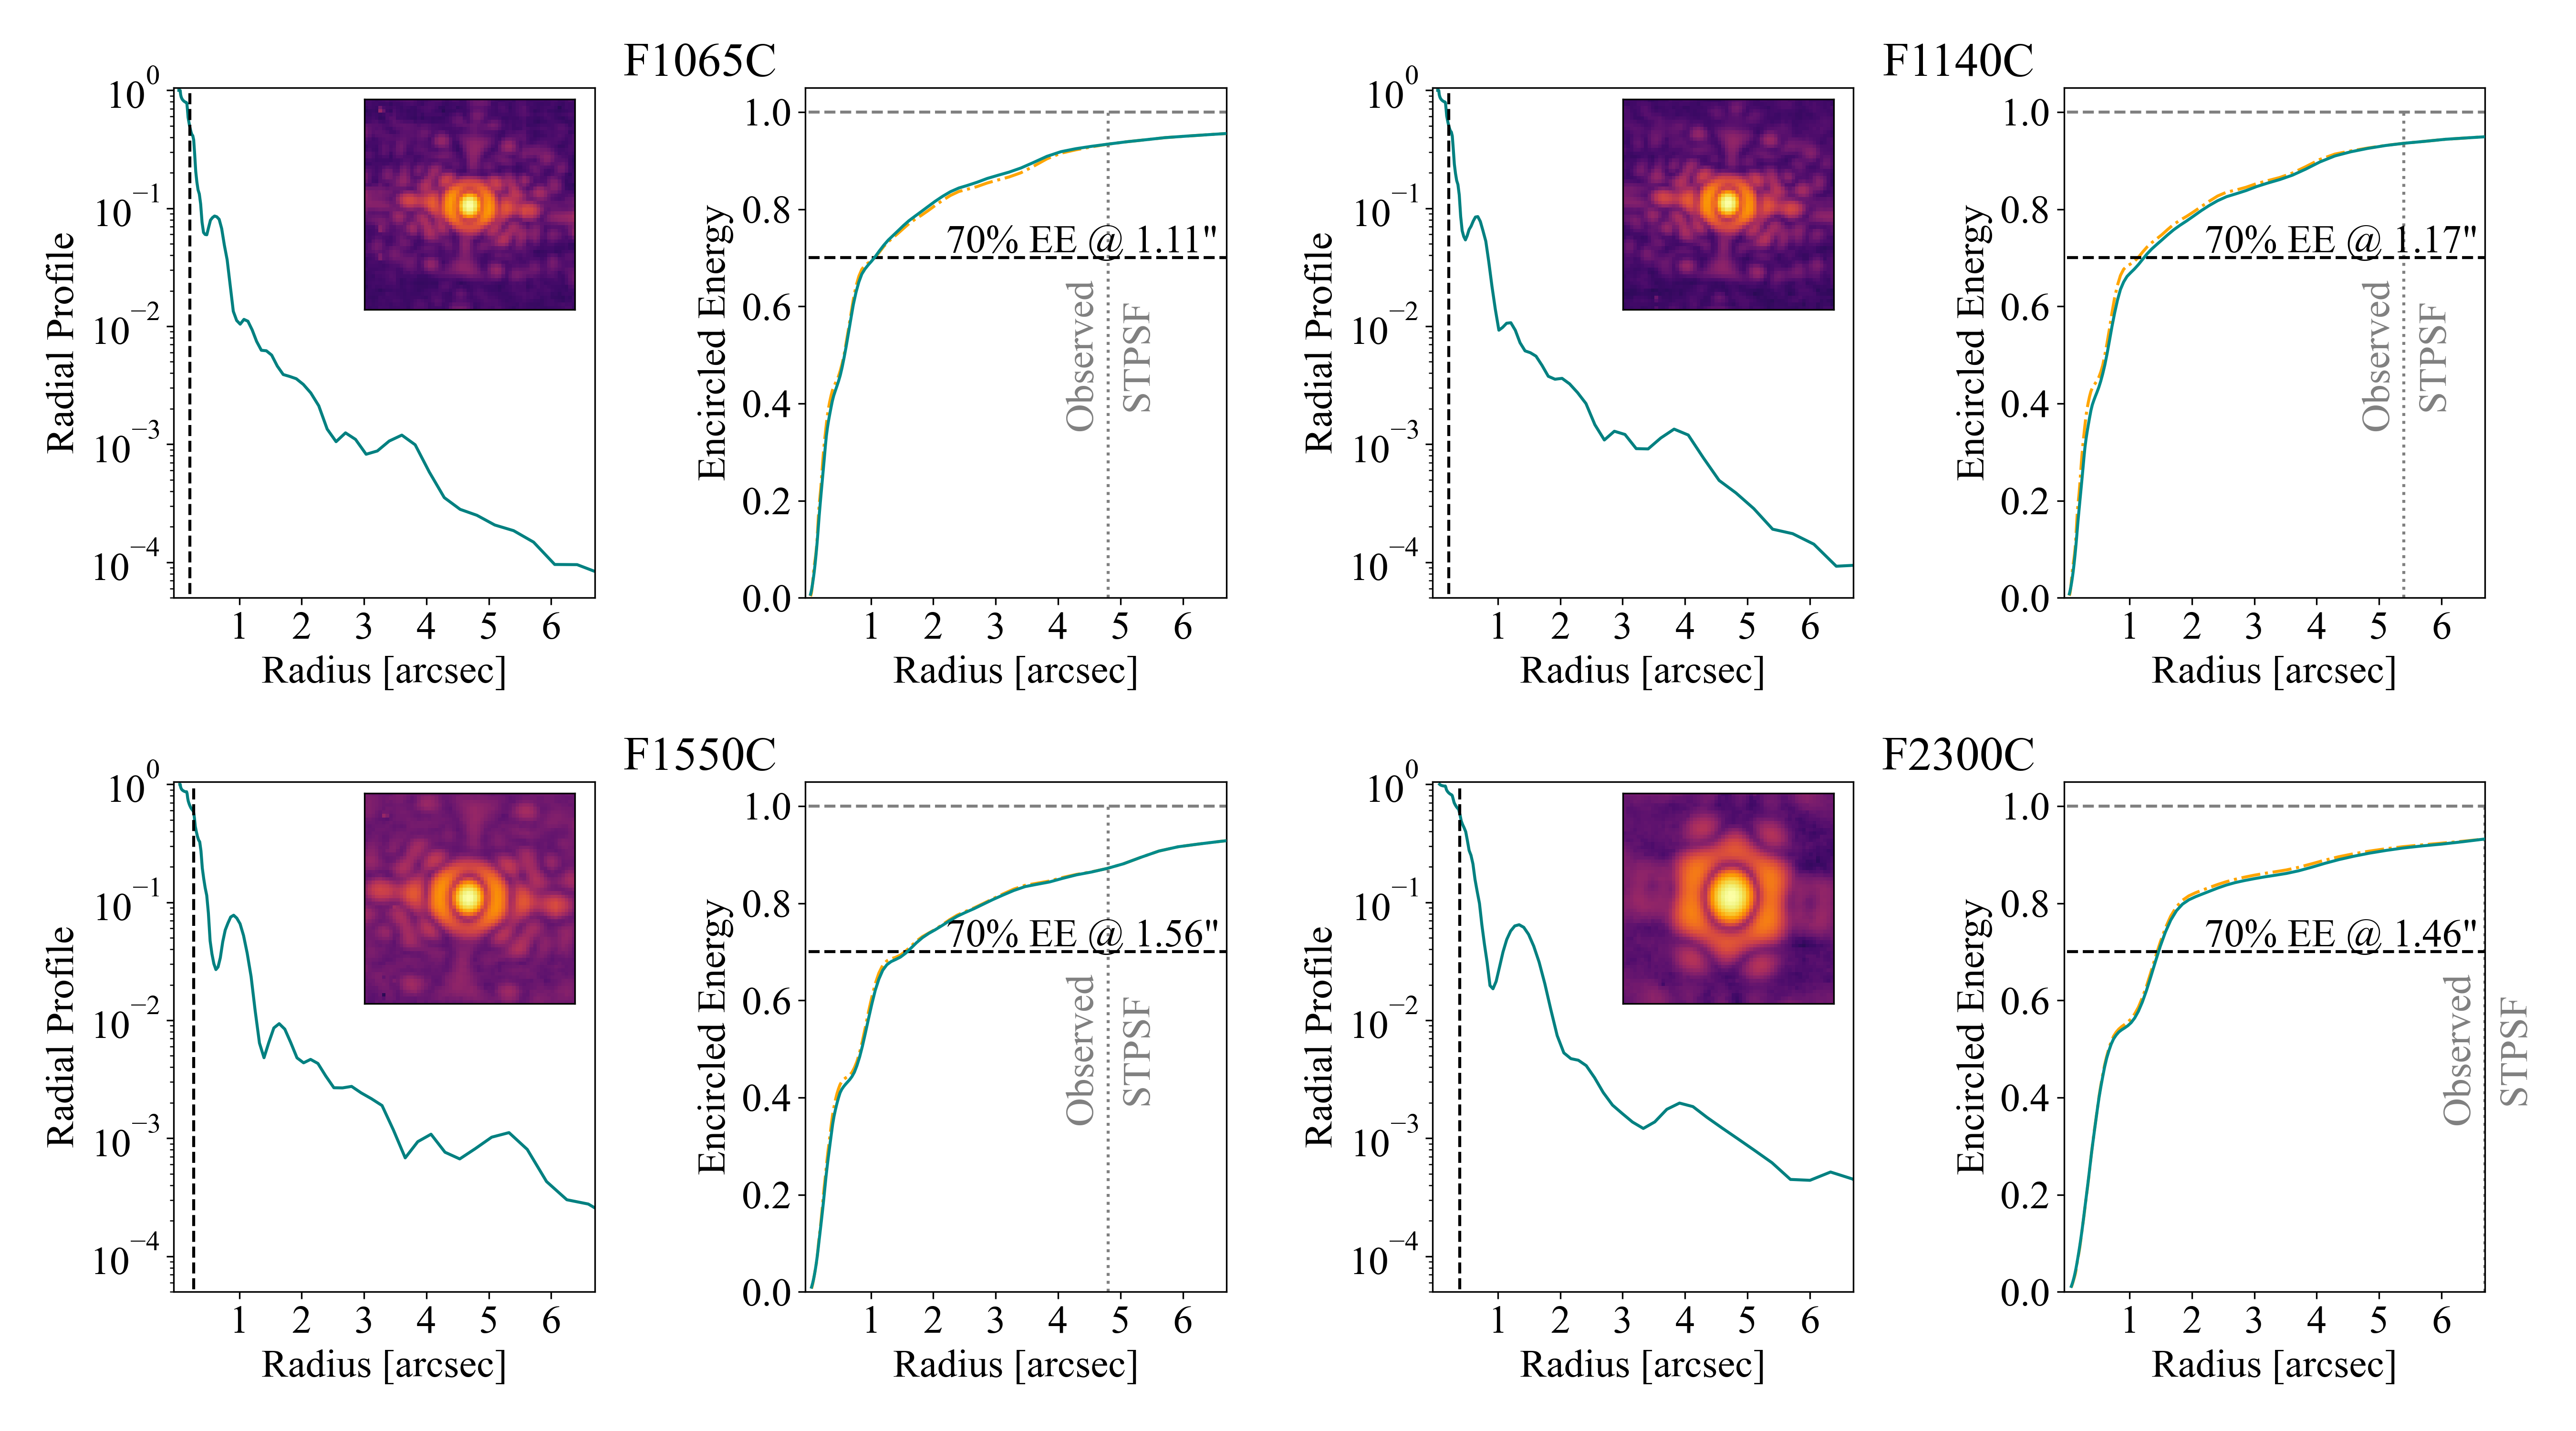
Figure 4 demonstrates the unocculted PSFs of the 4QPM filters (F1065C, F1140C, F1550C) and the Lyot coronagraph filter (F2300C) for A-dwarf calibration star δ UMi (see Gordon et al. (2025) for details). Figure 5 shows the radial and encircled energy profiles, constructed by combining the observed PSF for the inner radii with STPSF models for the outer radii, as described for the imager filters above and in Gordon et al.
Click on the figure for a larger view.
MIRI observations of δ UMi in the 4QPM and Lyot coronagraphs. The coronagraphic observations were taken well away from the coronagraphic centers, so these are unocculted PSFs. Data reduction was carried out as described in Gordon et al. (2025). Cutouts are 16” (~146 native pixels) on a side.
Click on the figure for a larger view.
For each MIRI coronagraphic filter, the radial (left) and encircled energy (right) profiles are shown (green, solid line), constructed by combining observations of δ UMi, HD 2811, and HD167060 (PIDs 1536, 1538) in the inner radii with STPSF models for the outer radii. The point where observations and models were joined are marked (dotted gray line). The STPSF model is shown at all radii (orange dot-dash line) for reference.
References
Argyriou I., et al. 2023, A&A, 680, 96
The brighter-fatter effect in the JWST MIRI Si:As IBC detectors. I. Observations, impact on science, and modeling
Gaspar, A., et al., 2021, PASP, 133, 4504
The Quantum Efficiency and Diffractive Image Artifacts of Si:As IBC mid-IR Detector Arrays at 5-10 μm: Implications for the JWST/MIRI Detectors
Gordon, K. et al. 2025, ApJ, 169, 6
The James Webb Space Telescope Absolute Flux Calibration. II. Mid-infrared Instrument Imaging and Coronagraphy
Libralato, M., et al., 2024, PASP, 136, 4502
High-precision Astrometry and Photometry with the JWST/MIRI IMager
Rigby, J., et al. 2023, PASP, 135, 1046
The Science Performance of JWST as Characterized in Commissioning