NIRCam Detector Readout Patterns
JWST NIRCam integrations are defined as groups of detector readouts, some of which are averaged and others skipped, according to MULTIACCUM patterns.
On this page
As charge accumulates during a NIRCam integration, the detectors are read out multiple times, non-destructively, sampling the data while conserving the charge in each pixel. This MULTIACCUM technique enables “up-the-ramp” fitting to determine the count rate from multiple data samples obtained over time. Up-the-ramp fitting facilitates cosmic ray rejection, reduces the effective readout noise (approximately by the square root of the number of samples), and increases the dynamic range of the final image (sampling bright sources before they saturate).
The voltage of each pixel is sampled and converted to a 16-bit (2 Bytes) integer in 10 µs. This data rate could originate 540 GB/day (accounting for overheads) when using all 10 detectors with 4 simultaneous outputs each. Such a data volume would overfill the onboard solid state recorder, which can store about 57 GB of data for science, downloaded twice daily.
To reduce the data rate and enable longer exposures, integrations must adopt predetermined readout patterns (see Figure 1). Each readout pattern produces a ramp containing up to 20 data points for up-the-ramp fitting. A data point is obtained by averaging as many as 8 individual samples, or frames (Nframes), followed by other samples that are discarded (Nskip). The combination of averaged and skipped samples, Nsamples=Nframes+Nskip, is a group. A readout pattern is thus made by up to 20 groups, or Ngroup=20.
Groups containing a larger number of averaged frames yield lower readout noise but also allow more time for a potential cosmic ray impact, in which case the entire group, and possibly all those who follow, must be discarded. Choosing the best readout pattern thus involves a tradeoff. Averaging more frames generally yields a slightly higher signal-to-noise ratio, for a given group size and Nsamples (Robberto 2009, 2010).
Integrations are terminated by a reset, which clears accumulated charge from the pixels. Multiple integrations can be sequentially executed without interruption to produce an exposure. The exposure time can therefore be regarded as the photon collection duration at each dither position.
Figure 1. Charge accumulation within a pixel in a NIRCam exposure

This example shows an exposure consisting of 2 integration ramps, each with 3 groups using the SHALLOW4 readout pattern. Each groups contains 5 samples, with 4 frames averaged and one skipped frame. All group averages are saved along with the first frame of each integration. Note that skipped reads are not executed in the final group of each integration.
Available readout patterns
Words in bold are GUI menus/
panels or data software packages;
bold italics are buttons in GUI
tools or package parameters.
There are 6 available group sizes (Nsamples = 1, 2, 5, 10, 15, and 20) named according to their potential applications (RAPID, BRIGHT, SHALLOW, MEDIUM, MEDIUMDEEP, and DEEP, respectively). For example, a RAPID group consists of a single sample whereas a DEEP8 group contains 20 samples (Nsamples = 20), 8 of which are averaged (Nframes = 8) and 12 of which are skipped (Nskip = 12). With the exception of RAPID, the name of the readout patterns end with a number signifying Nframes, the number of averaged frames in each group. SHALLOW2 and SHALLOW4 both have groups of 5 samples, but Nframes = 2 and Nframes = 4, respectively.
The MEDIUMDEEP patterns are available to users starting in Cycle 4.
Each readout pattern may contain up to 10 groups (Ngroups = 10) or up to Ngroups = 20 for the DEEP2 and DEEP8 patterns, in most observing modes. Also, in most cases up to 10 integrations are allowed per exposure, as long as the total exposure time remains within allowed limits. Tighter restrictions are placed on the faster RAPID pattern, which is designed to save all frames: when all 10 full detectors are being read, exposures are limited to Ngroups = 1 or 2.
Each detector readout takes 10.737 s for the full frame (2048 × 2048 pixels using 4 outputs) or as little as 49.4 ms for the smallest supported science subarray (64 × 64 pixels). Since pixels are read out sequentially, the integration start and end time varies slightly from one pixel to the next. The total integration time, however, is identical for all pixels.
The tables and diagrams below illustrate the 9 readout patterns available for NIRCam observations. Tables 2 and 3 give total integration times achievable with multiple groups.
Table 1. Available NIRCam MULTIACCUM readout patterns
| Readout pattern | Samples per group (Nsamples = Nframes + Nskip) | Frames averaged in each group (Nframes) |
|---|---|---|
| RAPID | 1 | 1 |
| BRIGHT1 | 2 | 1 |
| BRIGHT2 | 2 | 2 |
| SHALLOW2 | 5 | 2 |
| SHALLOW4 | 5 | 4 |
| MEDIUM2 | 10 | 2 |
| MEDIUM8 | 10 | 8 |
| MEDIUMDEEP2 | 15 | 2 |
| MEDIUMDEEP8 | 15 | 8 |
| DEEP2 | 20 | 2 |
| DEEP8 | 20 | 8 |
| DHSn* | Only available for short wavelength grism time series | |
Figure 2. Charge accumulation schematic diagrams for all available NIRCam readout patterns

Click on the figure for a larger view.
Diagrams of all readout patterns described in Table 1. Blue frames are co-added and saved as groups; red frames are skipped. Axes are signal vs. time as in Figure 1.
Frame 0
For all readout patterns that involve averaging frames into groups (i.e., all patterns except RAPID or BRIGHT1), the initial frame will always be saved and is termed “frame 0”. It is saved as a separate extension in the data file, and its purpose is to increase the dynamic range of the data. If the first averaged group of an integration is saturated, then the photon count rate cannot be determined; however, frame 0 may not have reached full well and could therefore be used to estimate the count rate (see Figure 3). Similarly, if an integration has been contaminated by a cosmic ray that hits within the first group (and after the first frame), frame 0 may still be trusted even though the group has to be discarded.
Because the count rate in such cases would be determined by calculating the slope using frame 0 only, it is important that the bias of the detectors is very well characterized. Any uncertainty on the signal level at the very beginning of an integration (the “reset” or “bias” level) due to, for example, global electronic offsets or pixel-dependent kTC (thermal) noise, would have a significant effect on slopes determined using only frame 0 (Rest 2018). If the count rate measured in frame 0 is very high, the associated Poisson noise can dominate the uncertainty of the reset level, making the use of the single frame 0 data point entirely appropriate.
Figure 3. An example SHALLOW4 ramp that saturates in the first averaged group
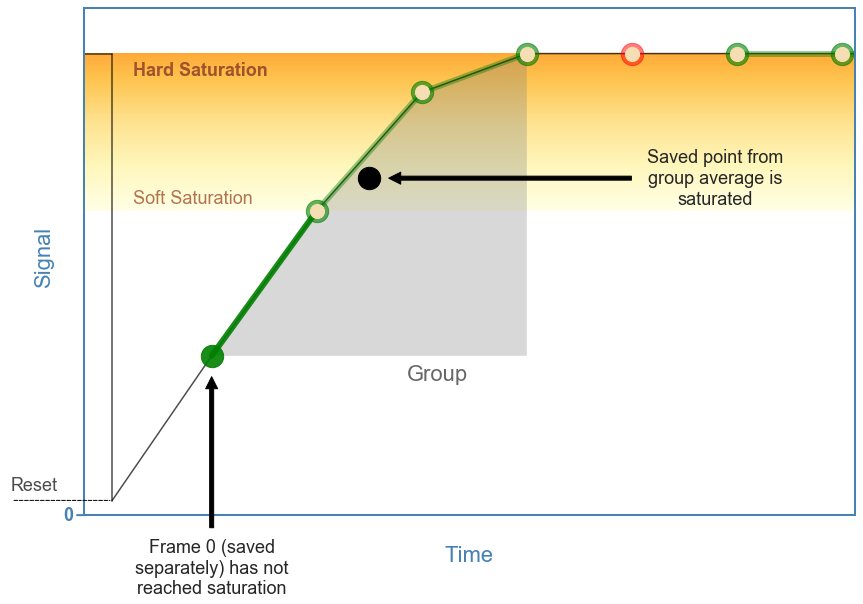
In this example of a SHALLOW4 integration ramp, the first averaged group is "soft" saturated—the non-linearity in the ramp becomes significant enough that it cannot be reliably corrected. The signal level in subsequent groups reaches full well depth, or "hard" saturation. Saturated groups must be discarded and cannot be used to determine the count rate. Frame 0, saved separately, is not saturated and can be used to determine the count rate. The reset point is offset slightly from a signal level of 0 to indicate the uncertainty on the bias level.
Integration times
Tables 2 and 3 give integration times for groups of reads of the full frame detector (2048 × 2048 pixels) using 4 outputs.
Integration time = Tframe × [(Nframes + Nskip) × (Ngroups -1) + Nframes] = Tframe × (Ngroups × Nsamples – Nskip)
having defined Nsamples = Nframes + Nskip .
Tframe = 10.73677 s for the full detector that's read out through 4 outputs. Note that skipped reads at the end of an integration are not executed.
For example, 3 groups of SHALLOW4 consist of 2 groups of 5 reads plus a final group of 4 reads. The 14 total reads of the full detector take 150.3 s. Each pixel collects photons for this amount of time.
Table 2. Pixel integration times (s) for groups of short readout patterns for the full detector
| GROUP PATTERN | RAPID | BRIGHT1 | BRIGHT2 | SHALLOW2 | SHALLOW4 | |
|---|---|---|---|---|---|---|
| GROUP PARAMETERS | Nsamples | 1 | 2 | 2 | 5 | 5 |
| Nframes | 1 | 1 | 2 | 2 | 4 | |
| Nskip | 0 | 1 | 0 | 3 | 1 | |
| Ngroups | 1 | 10.7 | 10.7 | 21.5 | 21.5 | 42.9 |
| 2 | 21.5 | 32.2 | 42.9 | 75.2 | 96.6 | |
| 3 | 32.2 | 53.7 | 64.4 | 128.8 | 150.3 | |
| 4 | 42.9 | 75.2 | 85.9 | 182.5 | 204.0 | |
| 5 | 53.7 | 96.6 | 107.4 | 236.2 | 257.7 | |
| 6 | 64.4 | 118.1 | 128.8 | 289.9 | 311.4 | |
| 7 | 75.2 | 139.6 | 150.3 | 343.6 | 365.0 | |
| 8 | 85.9 | 161.1 | 171.8 | 397.3 | 418.7 | |
| 9 | 96.6 | 182.5 | 193.3 | 450.9 | 472.4 | |
| 10 | 107.4 | 204.0 | 214.7 | 504.6 | 526.1 |
Numbers of saved and skipped frames (Nframes and Nskip) are shown in green and red, respectively, as in Figure 2.
The RAPID pattern is limited to 2 groups per integration when reading out the full detectors in both modules. This limit increases to 10 groups (shown in gray in Table 2) when using a single module (both full detectors or subarrays). A single group of BRIGHT2 (also in gray) is disallowed when reading out the full detectors in both modules.
For all modes, the limit is always 10 groups for the BRIGHT, SHALLOW, MEDIUM, and MEDIUMDEEP patterns listed in Tables 2 and 3. For imaging and time-series imaging modes, the DEEP patterns are limited to 20 groups, but can vary in other modes.
Table 3. Pixel integration times (s) for groups of long readout patterns for the full detector
| GROUP PATTERN | MEDIUM2 | MEDIUM8 | MEDIUMDEEP2 | MEDIUMDEEP8 | DEEP2 | DEEP8 | |
|---|---|---|---|---|---|---|---|
| GROUP PARAMETERS | Nsamples | 10 | 10 | 15 | 15 | 20 | 20 |
Nframes | 2 | 8 | 2 | 8 | 2 | 8 | |
| Nskip | 8 | 2 | 13 | 7 | 18 | 12 | |
| Ngroups | 1 | 21.5 | 85.9 | 21.5 | 85.9 | 21.5 | 85.9 |
| 2 | 128.8 | 193.3 | 182.5 | 246.9 | 236.2 | 300.6 | |
| 3 | 236.2 | 300.6 | 343.6 | 408.0 | 450.9 | 515.4 | |
| 4 | 343.6 | 408.0 | 504.6 | 569.0 | 665.7 | 730.1 | |
| 5 | 450.9 | 515.4 | 665.7 | 730.1 | 880.4 | 944.8 | |
| 6 | 558.3 | 622.7 | 826.7 | 891.2 | 1095.1 | 1159.6 | |
| 7 | 665.7 | 730.1 | 987.8 | 1052.2 | 1309.9 | 1374.3 | |
| 8 | 773.0 | 837.5 | 1148.8 | 1213.3 | 1524.6 | 1589.0 | |
| 9 | 880.4 | 944.8 | 1309.9 | 1374.3 | 1739.4 | 1803.8 | |
| 10 | 987.8 | 1052.2 | 1470.9 | 1535.4 | 1954.1 | 2018.5 | |
| 11 | 2168.8 | 2233.2 | |||||
| 12 | 2383.6 | 2448.0 | |||||
| 13 | 2598.3 | 2662.7 | |||||
| 14 | 2813.0 | 2877.5 | |||||
| 15 | 3027.8 | 3092.2 | |||||
| 16 | 3242.5 | 3306.9 | |||||
| 17 | 3457.2 | 3521.7 | |||||
| 18 | 3672.0 | 3736.4 | |||||
| 19 | 3886.7 | 3951.1 | |||||
| 20 | 4101.4 | 4165.9 |
Readout pattern selection
The ETC should be used to determine the optimal readout pattern for each observing mode, given the brightness of the target and the desired signal-to-noise. As a rule of thumb, the user may consider that averaging more frames delivers lower readout noise, at the price of a somewhat higher loss of pixels by cosmic rays. To mitigate against cosmic rays, users may choose a large number of groups (which increases data volume) and/or breaking the integrations in shorter, possibly dithered, integrations. Data indicate that integrations longer than ~1,000s, corresponding to the longest exposures (10 groups) with MEDIUM2 or MEDIUM8, may be heavily affected by cosmic rays, with losses of signal-to-noise especially in areas that may not be covered by multiple exposures.
References
Rest, A., 2018, JWST-STScI-006203
Frame 0 Analysis for NIRCam Integrations
Robberto, M., 2009, JWST-STScI-001721
NIRCAM Optimal Readout Modes
Robberto, M., 2010, JWST-STScI-002100
NIRCAM Optimal Readout II: General Case (Including Photon Noise)