NIRISS GR150 Grisms
The JWST NIRISS GR150C and GR150R grisms produce spectra for wavelengths between 0.8 and 2.2 μm with a resolving power in first order of R ≈ 150. They are used with blocking filters to enable wide field slitless spectroscopy (WFSS).
On this page
See also:: NIRISS Wide Field Sliltess Spectroscopy, NIRISS Filters
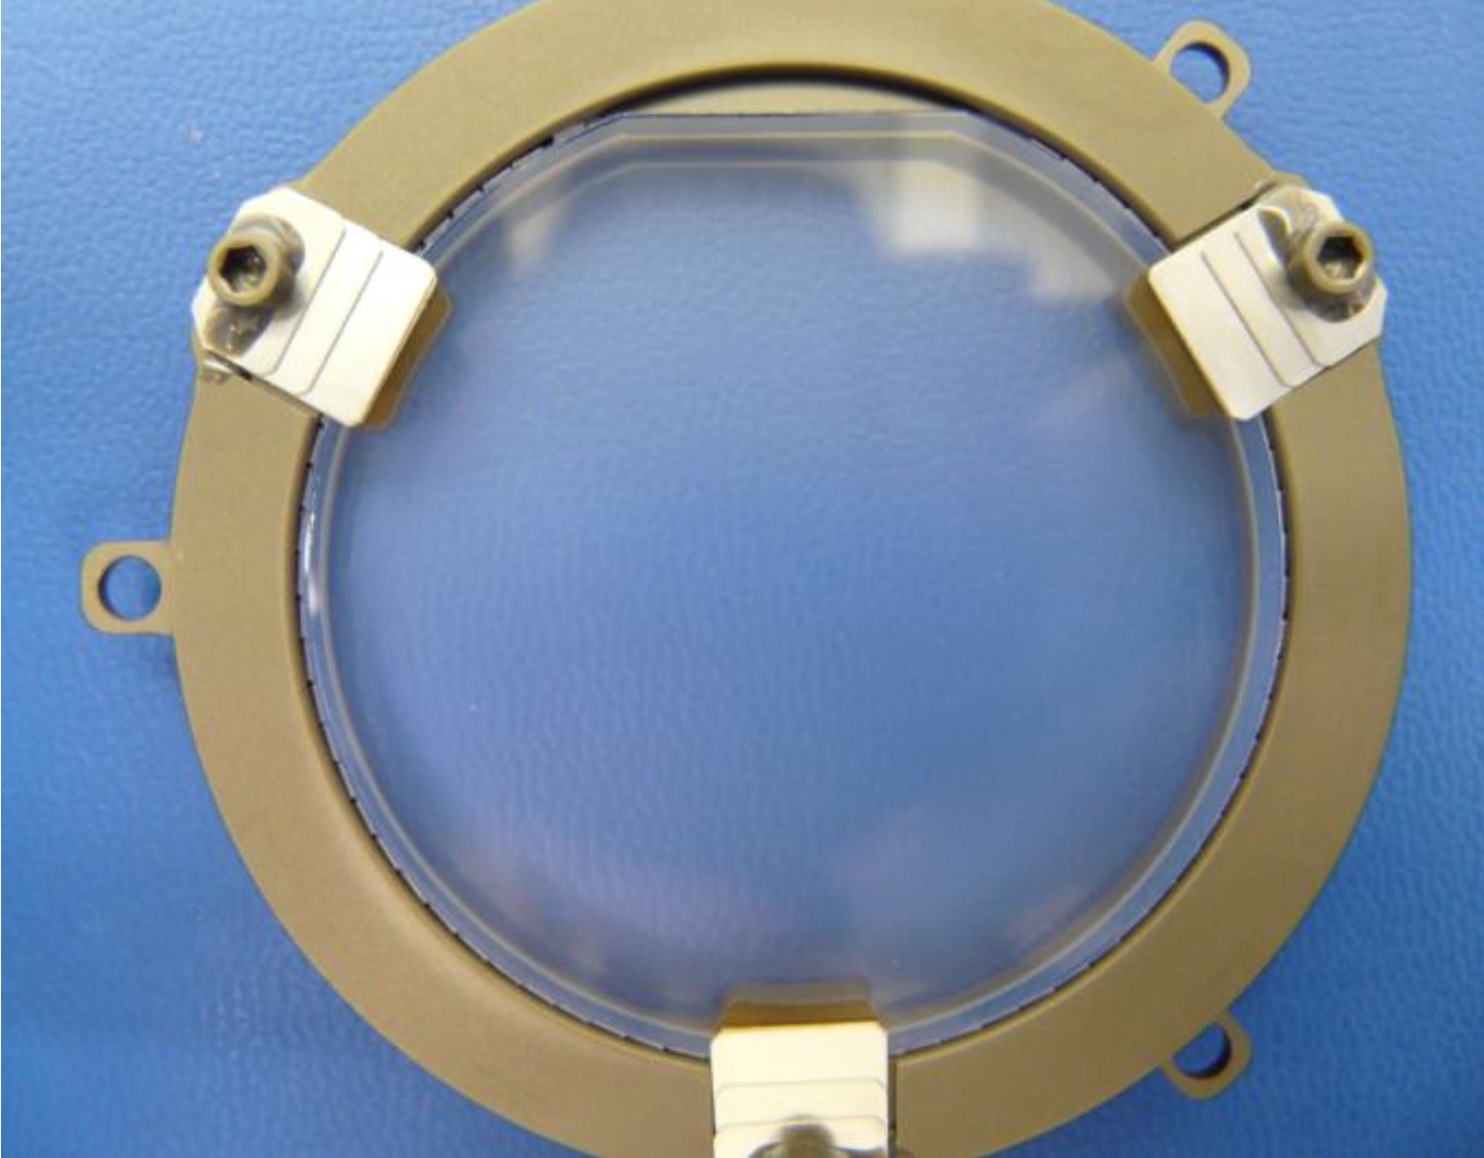
The NIRISS GR150C and GR150R grisms produce spectra of essentially all objects in the field of view with a resolving power of of R ≡ λ/Δλ ≈ 150 over the wavelength range between 0.8 and 2.2 μm. When used with a blocking filter, these grisms enable the WFSS mode of NIRISS. Figure 1 shows the GR150R grism before it was mounted in the filter wheel.
Properties
See also: NIRISS Sensitivity, NIRISS Bright Limits
The GR150C and GR150R are identical optical elements though in-flight characterization during commissioning revealed different throughputs between the grisms. Their physical properties are summarized in Table 1, and leads to the following optical performance characteristics:
- Dispersion: The wavelength dispersion has been measured in-flight for the center of the field and is linear for the first and second orders. For the first order, the dispersion is 47.015 ±0.017 A/pix for GR150C and 46.934 ±0.009 Å/pix for GR150R. For the second order, the dispersion is 23.864 ±0.004 Å/pix for GR150C and 23.859 ±0.003 Å/pix for GR150R (Pacifici 2022).
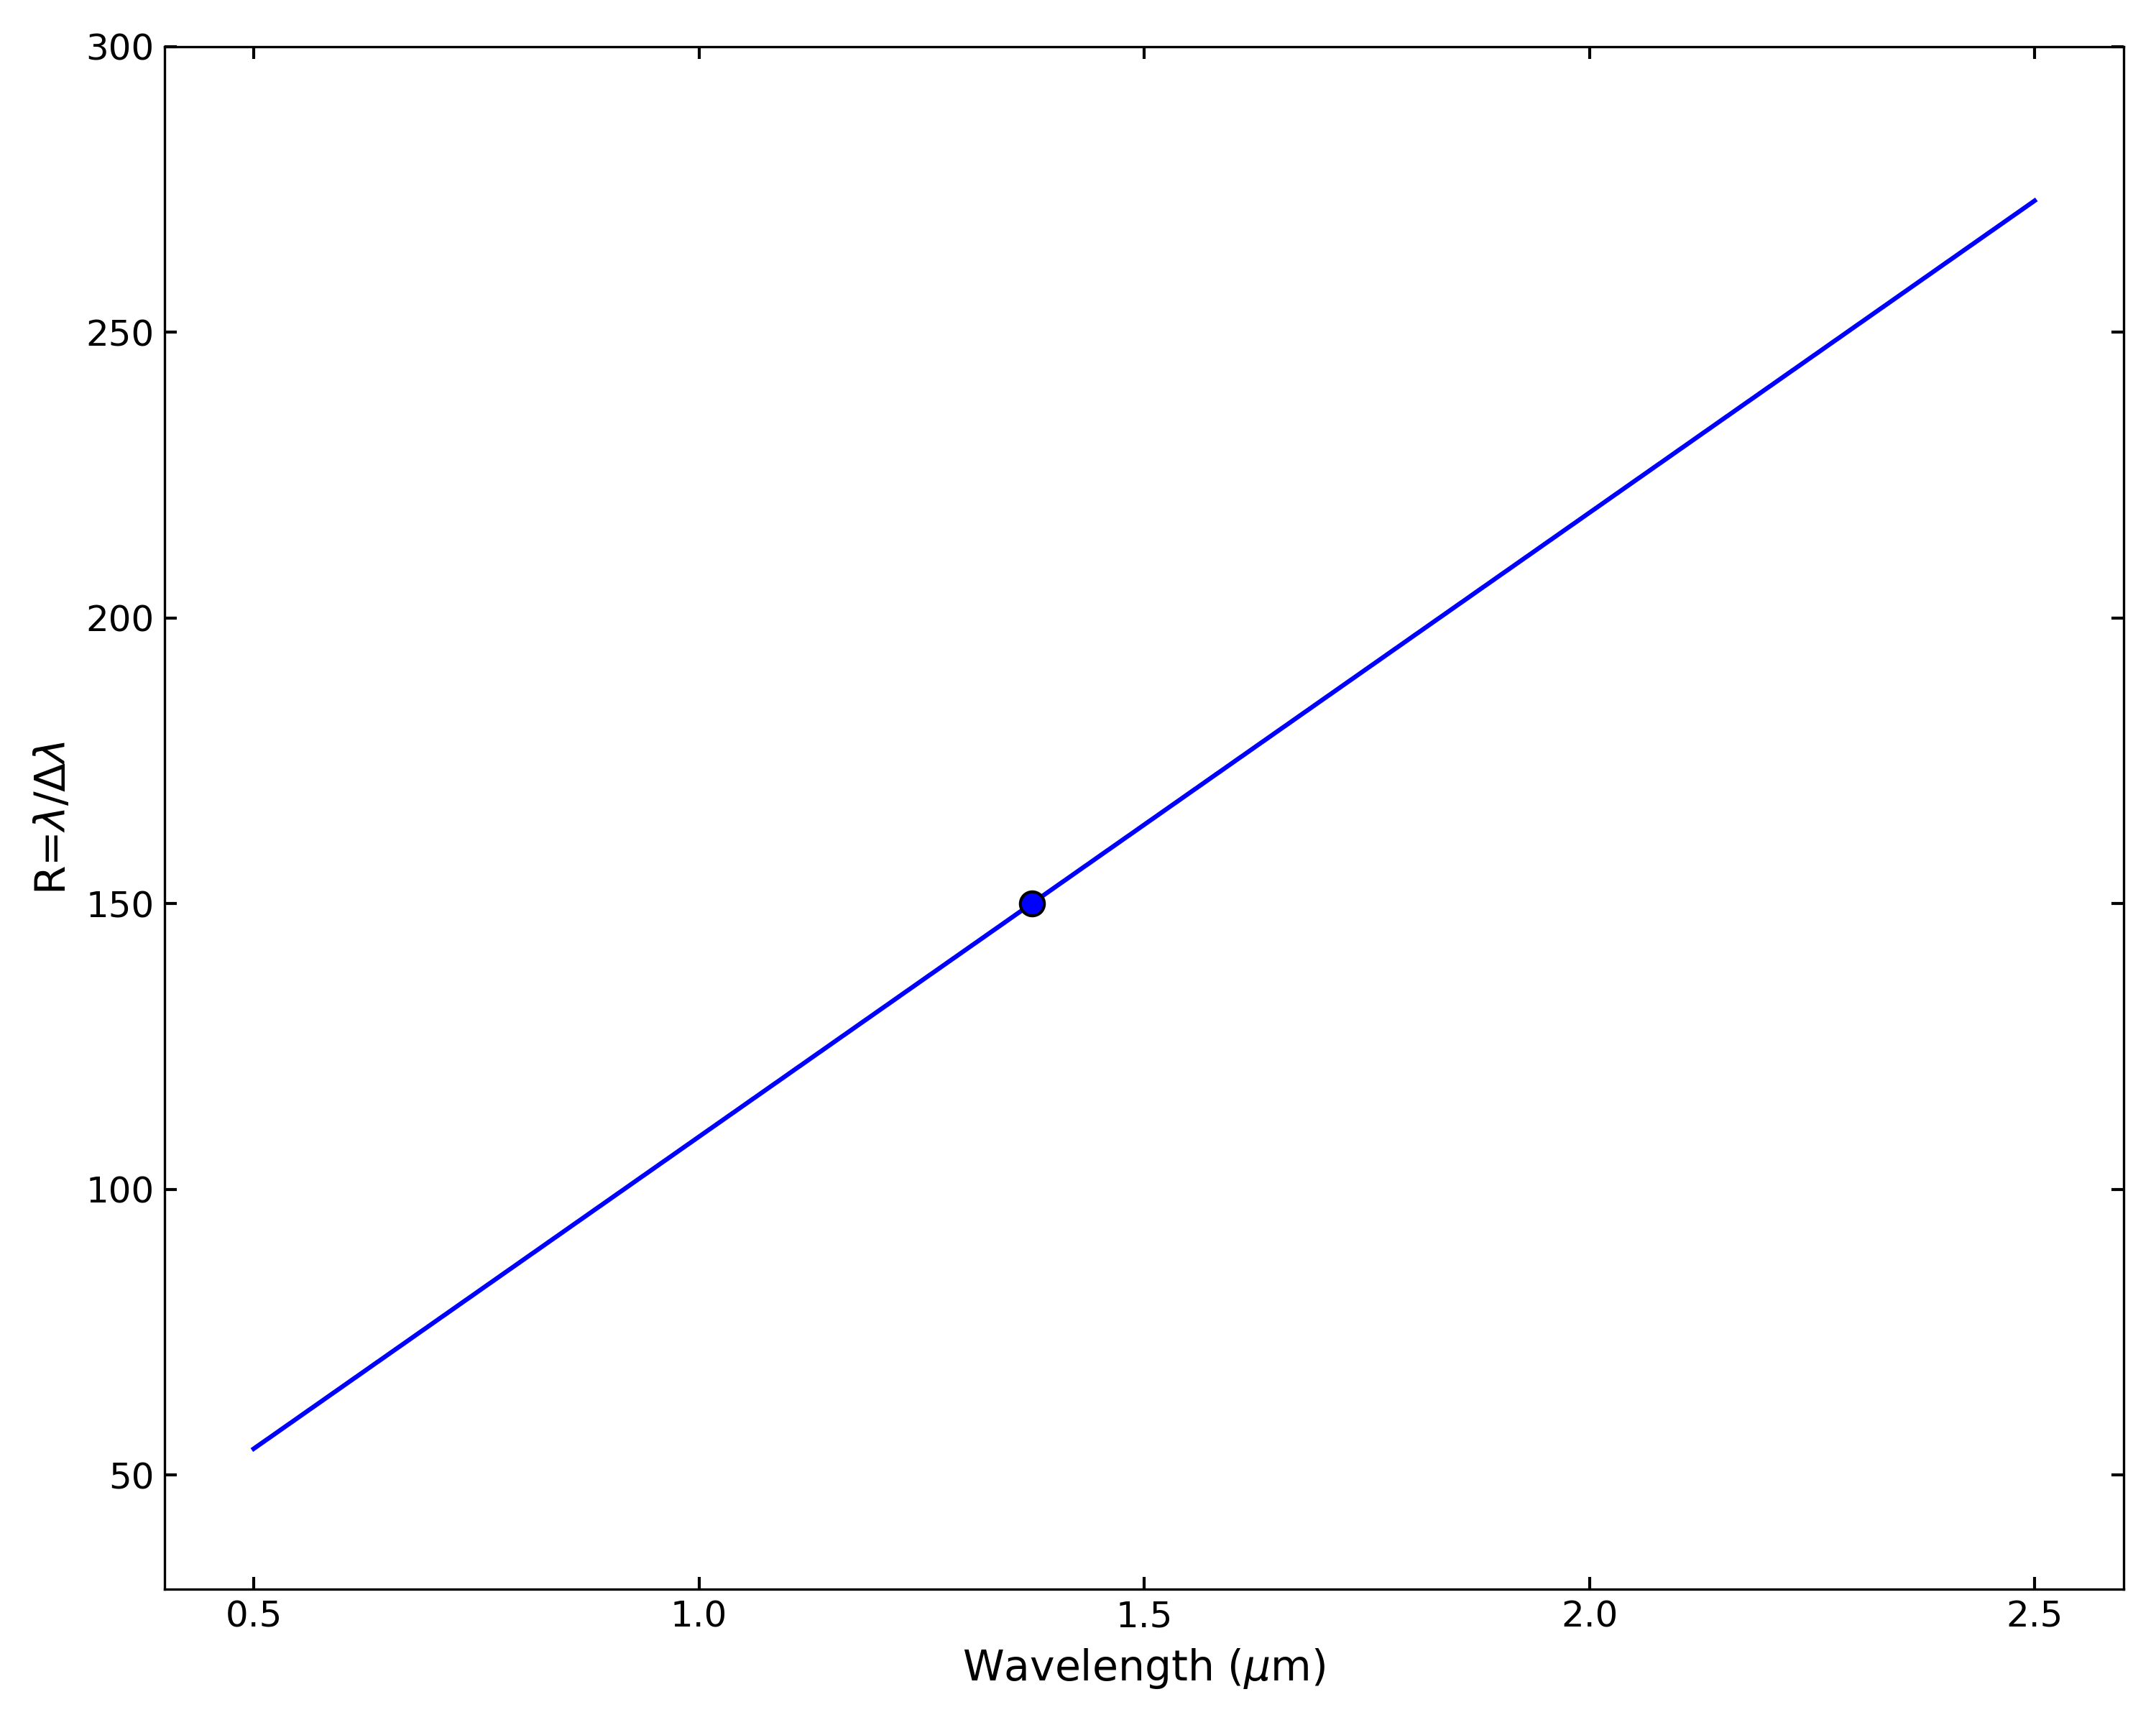
- Resolving power: The NIRISS point spread function is undersampled at the wavelengths covered by the GR150 grisms. Consequently, the resolving power for a point source is defined by the wavelength increment over 2 pixels, which is ~0.0094 μm at the center of the field. As shown in Figure 2, the resolving power is directly proportional to wavelength. Under many circumstances, the resolving power will actually be dictated by the angular size and geometry of the astronomical source.
- Throughput: Figure 3 shows the effective throughputs for the 1st and 2nd order of the GR150 grisms as measured from in-flight data. The photon-to-electron conversion efficiency (PCE) accounts for the throughput of the grism, throughput of the JWST and NIRISS internal optics, and detector quantum efficiency. The data for the PCE curves are available in the attached files for the GR150C grism and GR150R grism. GR150C has increased throughput in the 1st order compared with GR150R and may thus be preferred by observers of using only 1 grism for an observing program.
Table 1. Physical properties of the NIRISS GR150 grisms
Property | |
|---|---|
Substrate material | Infrasil 301 |
Prism angle | 1.5º |
Diameter of ruled area | 43 mm |
Groove density | 11.21 grooves/mm |
Blaze angle | 1.5º |
Blaze wavelength | 1.3 μm |
Resolution element | 0.0094 μm |
Dispersion Direction
See also: NIRISS Detector Readout, JWST Instrument Ideal Coordinate Systems
Although the properties of the GR150C and GR150R grisms are identical, they are mounted in the filter wheel so that the spectra they produce are dispersed in orthogonal directions on the detector; see Figure 4. In the coordinate system used by the JWST calibration pipeline, the GR150C grism disperses in the "slow" direction of detector readout, while the GR150R grism disperses in the "fast" readout direction. This geometry is indicated in Figure 5. Access to spectra obtained in both directions helps to combat problems with blending, especially in crowded fields; and maximizes the chance that a "clean" spectrum can be extracted from the data.
Blocking filters
See also: NIRISS Filters
The GR150 grisms are used with a blocking filter, which isolates a specific range of wavelengths. As a result, the length of the trace of the first order spectrum on the detector is reduced, which lessens the degree of overlapping and blending in crowded fields.
Table 2 summarizes these characteristics:
- the bandpasses associated with the available blocking filters;
- the range of redshifts of Lyman α emission that fall within the bandpass;
- the length of the spectral trace in pixels on the detector; and
- the relative offset in pixels between the direct image of the source and the beginning of its spectral trace (assuming there have been no intervening motions of the observatory).
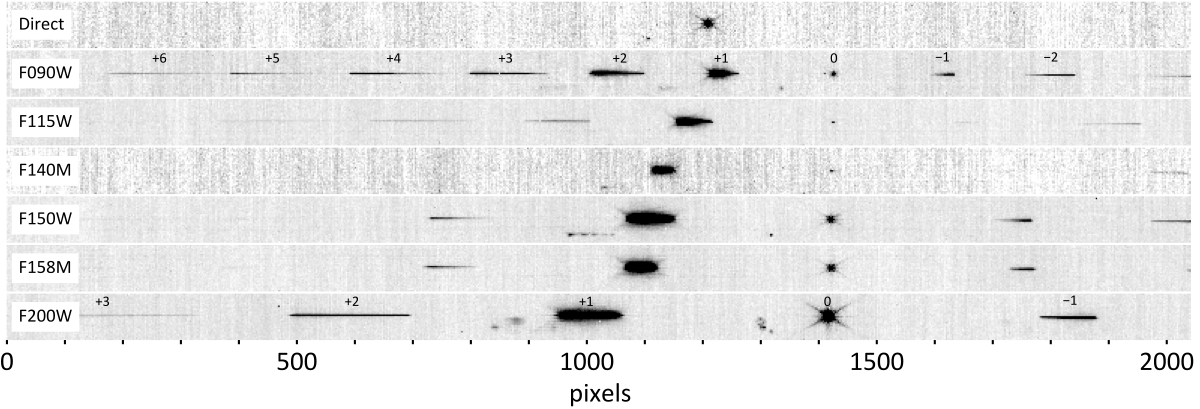
This information is presented graphically in Figure 6, which shows the extent and offsets associated with multiple orders of the GR150C grism when observed through different blocking filters.
Table 2. Length and location of the first order spectra produced by the GR150 grisms
Blocking filter | Central wavelength (μm) | Bandpass† (μm) | Extent of 1st order (pixels) | Offset from direct image (pixels) |
|---|---|---|---|---|
F090W | 0.901 | 0.796-1.005 | 50 | −56 |
F115W | 1.148 | 1.013-1.283 | 60 | −6 |
F140M | 1.406 | 1.331-1.480 | 40 | 60 |
F150W | 1.501 | 1.330-1.671 | 80 | 55 |
F158M | 1.588 | 1.488-1.688 | 60 | 90 |
F200W | 1.989 | 1.751-2.226 | 120 | 147 |
† Defined by the 50% transmission points of the blocking filter.
Figure 6 shows the layout of spectroscopic orders of the GR150C grism for a source that is located near the center of the detector. Since the trace of the first order (m = +1) spectrum is offset from the position of its source, spectra of objects close to the edge of the detector will not be captured. How close the source must be depends on the blocking filter. For example, if the source indicated in Figure 6 was located at x-pixel location of 100, the first order spectrum through the F090W filter would be detected, while the first order spectrum through the F200W filter would not be recorded. As a result, there is a region along one side of the field of view of the detector where spectra will not be recorded, which means that the "effective" field of view for wide field slitless spectroscopy is slightly smaller than the imaging field of view. The maximum width of this exclusion zone is ~170 pixels for the F200W filter.
Ghosts
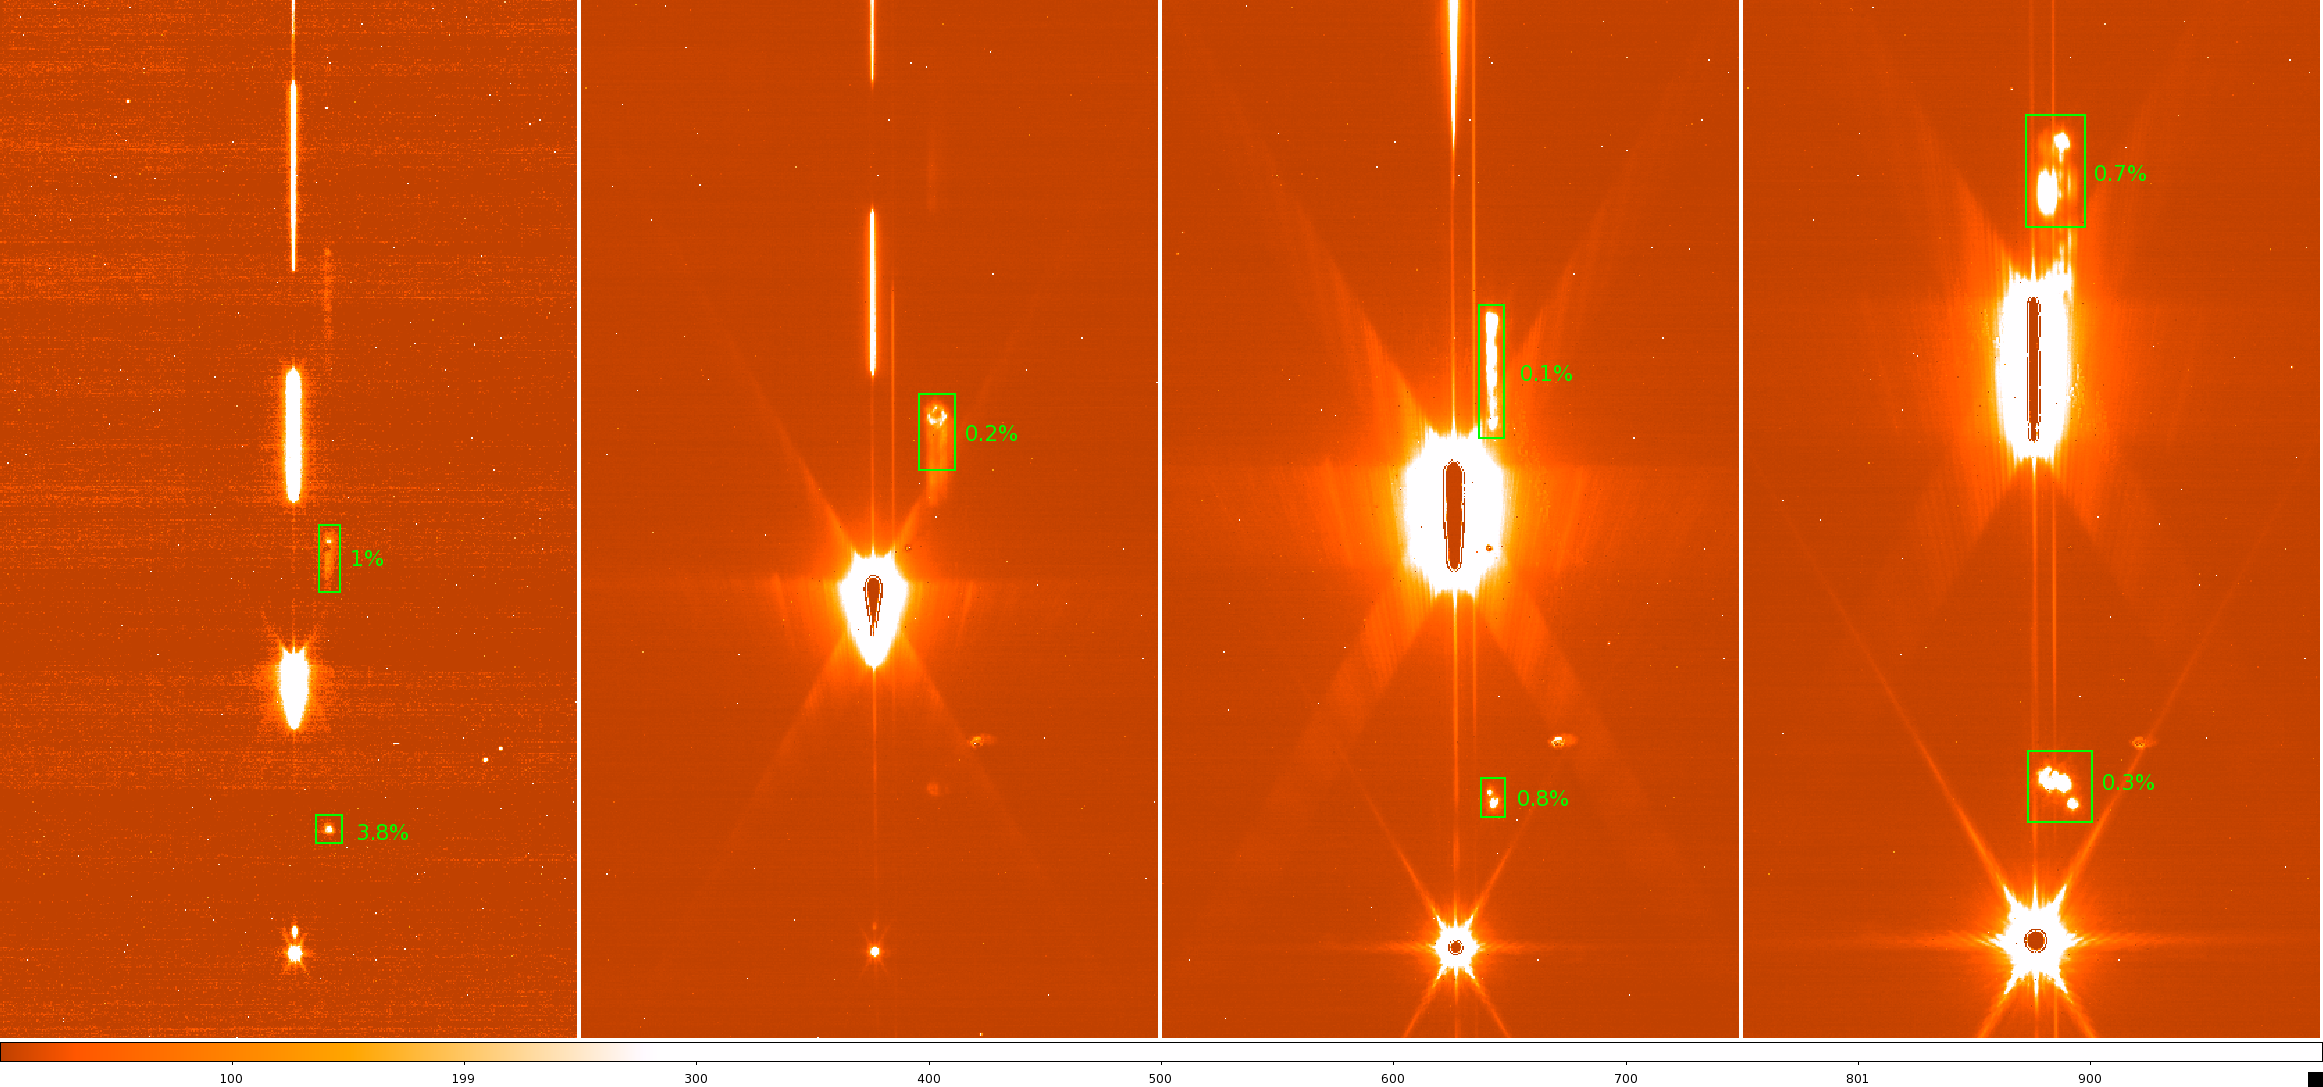
Out-of-focus "ghost" images produced by multiple reflections within the optical trains of NIRISS have been detected in deep exposures of bright sources obtained during ground test campaigns. The "double stack" filters, which are composed of 2 optical elements, are especially prone to multiple internal reflections. Figures 7 and 8 show the families of ghosts that have been identified in deep exposures that combine double stack filters with the GR150C and GR150R grism, respectively. The strengths of the ghosts associated with the 0th and 1st (m = +1) orders are indicated as a fraction of the flux contained in the parent order. In general, the flux in the ghost image is less than 1% of flux in the parent order, which suggests that ghosts will only be detectable for the brightest sources in a typical exposure. The locations and strengths of the ghosts associated with a particular bright source can be predicted reliably.
References
Pacifici, C. 2022 JWST-STScI-008296
NIRISS Commissioning Results: NIS-016 GR150C and GR150R Grism Wavelength Calibration (NGAS CAR 700, APT 1090)


