NIRSpec Detector Performance
The JWST NIRSpec detectors, NRS1 and NRS2, performance has been characterized for read noise, detector gain, dark current, non-linearity, saturation, quantum efficiency, persistence, and inter-pixel capacitance.
On this page
The NIRSpec detectors (a.k.a sensor chip assemblies; SCAs) have been optimized to balance a variety of performance metrics such as read noise, dark current, and saturation well depth.
The following sections present characteristics of the 2 NIRSpec detectors, called NRS1 and NRS2, in the data processing and pipeline systems. The performance data presented here have been measured at the in-orbit operating temperature of 42.8 K, mostly based on commissioning data, with some measurements still stemming from ground tests as they cannot be repeated on-orbit. Ground testing at detector level was performed at the Detector Characterization Lab at NASA Goddard Space Flight Center in 2014, and tests in a flight-like configuration at instrument level were carried out between December 2015 and July 2017.
Detector gain
The detector gain is the ratio of electrons to detector count (typically expressed as data numbers, or DN). This number, measured for each detector pixel, is used primarily in the data processing pipeline as part of the calculation of the "shot" or "Poisson" noise contribution to the total noise per pixel in an integration. Pixel-to-pixel gain maps for the 2 SCAs were constructed from data obtained during the detector characterization ground test campaign, using the classical photon transfer curve technique (Janesick, J. et al.,1987). The average gain value for both SCAs in full frame readout is near unity. The gain map for NRS1 (Figure 1, Sirianni 2017) exhibits a very uniform distribution, with a small area of slightly lower values at the lower center caused by a known "epoxy void" defect. The map for NRS2 (Figure 1) is also uniform, though with a slight gradient at the ~5% level.
There is a different gain setting for subarray exposures which will provide an improved dynamic range for bright sources. The conversion gain is about a factor of 1.43 higher compared to full frame data for both SCAs. This was confirmed during ground-based testing.
Figure 1. NIRSpec detector NRS1 and NRS2 gain maps


Click on the figures for a larger view.
Conversion gain maps for NIRSpec detectors NRS1 (top) and NRS2 (bottom) as measured on ground. Grey scale is from 0.5 to 1.5 e-/DN. The average measured detector gain for good pixels is 0.996 e–/DN for NRS1 and 1.137 e–/DN for NRS2. The standard deviation for NRS1 and NRS2 respectively is 0.043 and 0.05 e–/DN. © Sirianni 2017.
Dark current
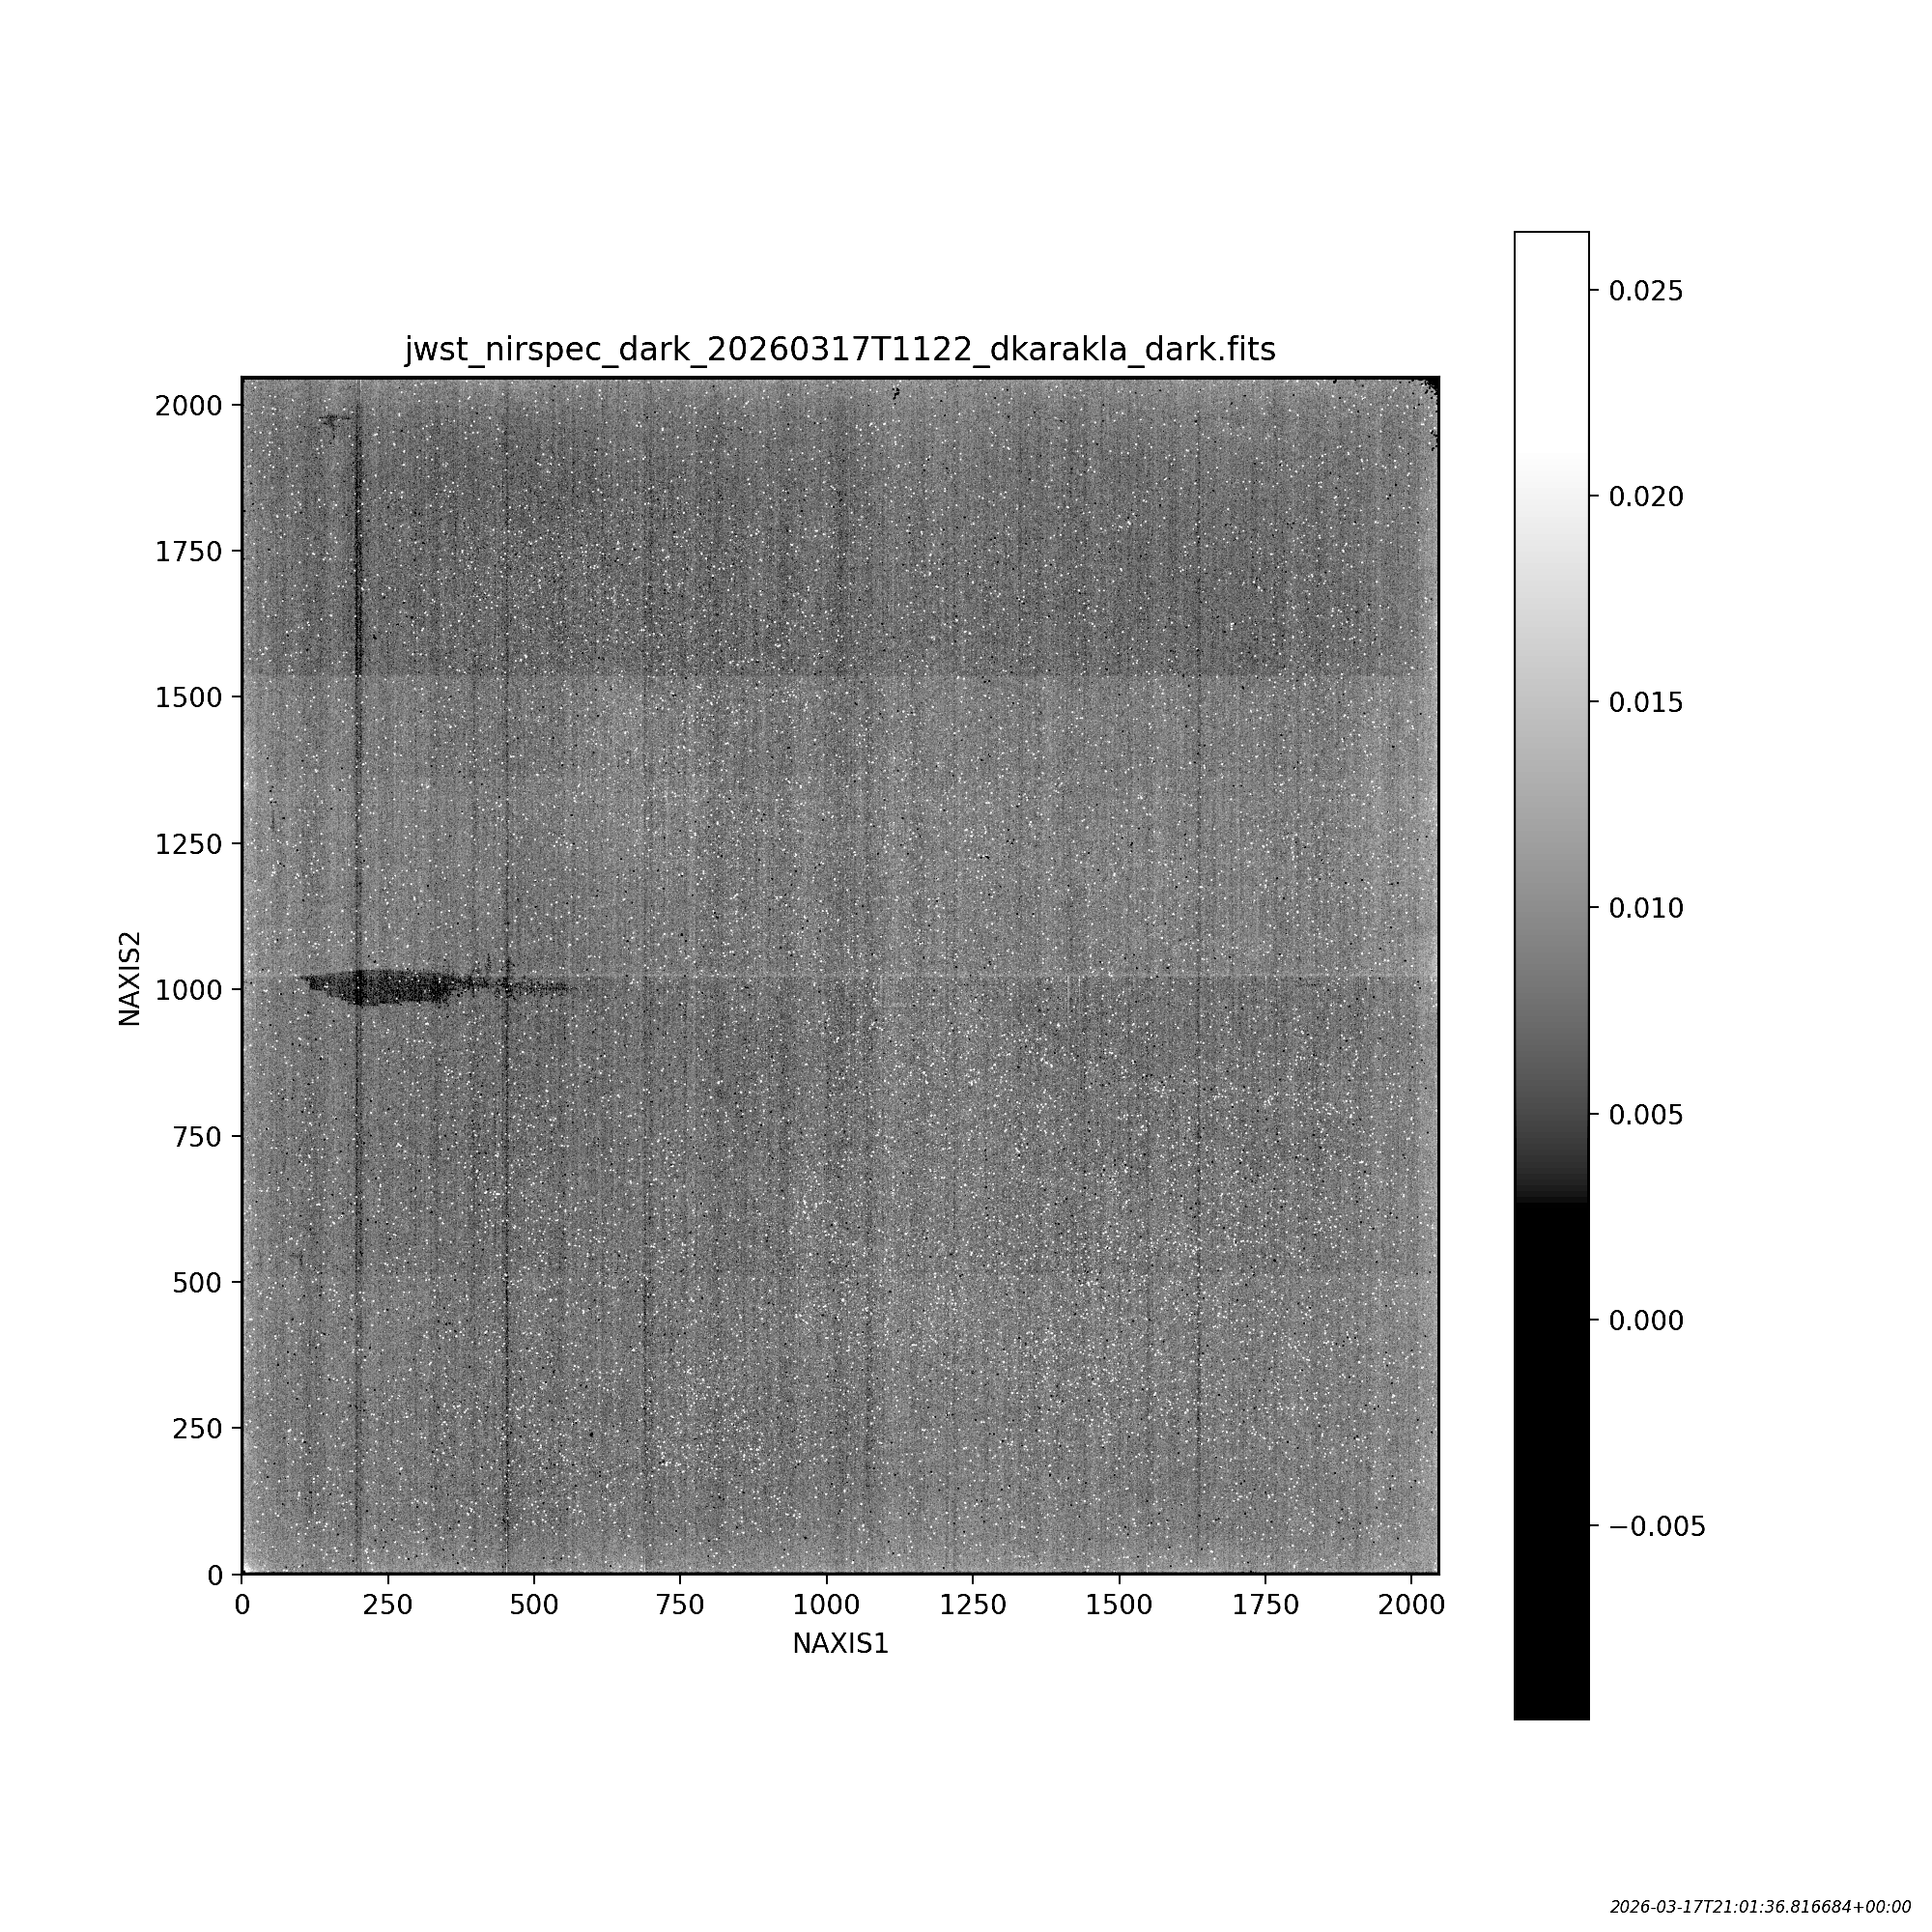
All infrared detectors exhibit some level of dark signal. By virtue of the low operating temperatures, NIRSpec's detectors show extremely low dark current values, with the observed dark signal being dominated by multiplexer glow (Regan & Bergeron 2020). The dark signal measured in orbit is slightly higher than measured during ground testing, probably due to the cosmic ray environment at L2. Nevertheless, the median dark signal for both the NRS1 and NRS2 NIRSpec detectors are well within the performance requirement of <0.01 e–/s. Figures 2 and 3 present the dark signal images for the NIRSpec detectors as measured during commissioning in traditional and IRS2 readout modes, respectively (Birkmann, S.M. et al., 2022). A small region on detector NRS1 at the center bottom has an "epoxy void" that is apparent as a region of lower dark current (also seen in Figure 1). The dark signal is higher for subarrays due to the shorter frame times and thus more reads per unit time, which results in more multiplexer glow observed.
Figure 2. NIRSpec detector dark current images traditional readout mode
Click on the figures for a larger view.
The NIRSpec detectors NRS1 (top) and NRS2 (bottom) dark images in traditional full frame readout mode, acquired by averaging nine or ten ~16 minute dark exposures. The 4 detector channels have very slight differences in dark current level, which is seen here as the 4 horizontal segments. The grey scale indicates the dark signal in e–/s. The median dark signal is 0.008 e–/s for NRS1 and 0.006 e–/s for NRS2. The 1/f vertical striping seen in these traditional darks is a common feature of this readout mode, however the amplitude of the 1/f striping is mitigated during science data reduction. These dark reference files are from early 2026 (found in CRDS as jwst_nirspec_dark_0537 (NRS1) and jwst_nirspec_dark_0541 (NRS2)). Similar full frame dark reference files are regularly delivered to CRDS and typically cover a period of 3–4 months each.
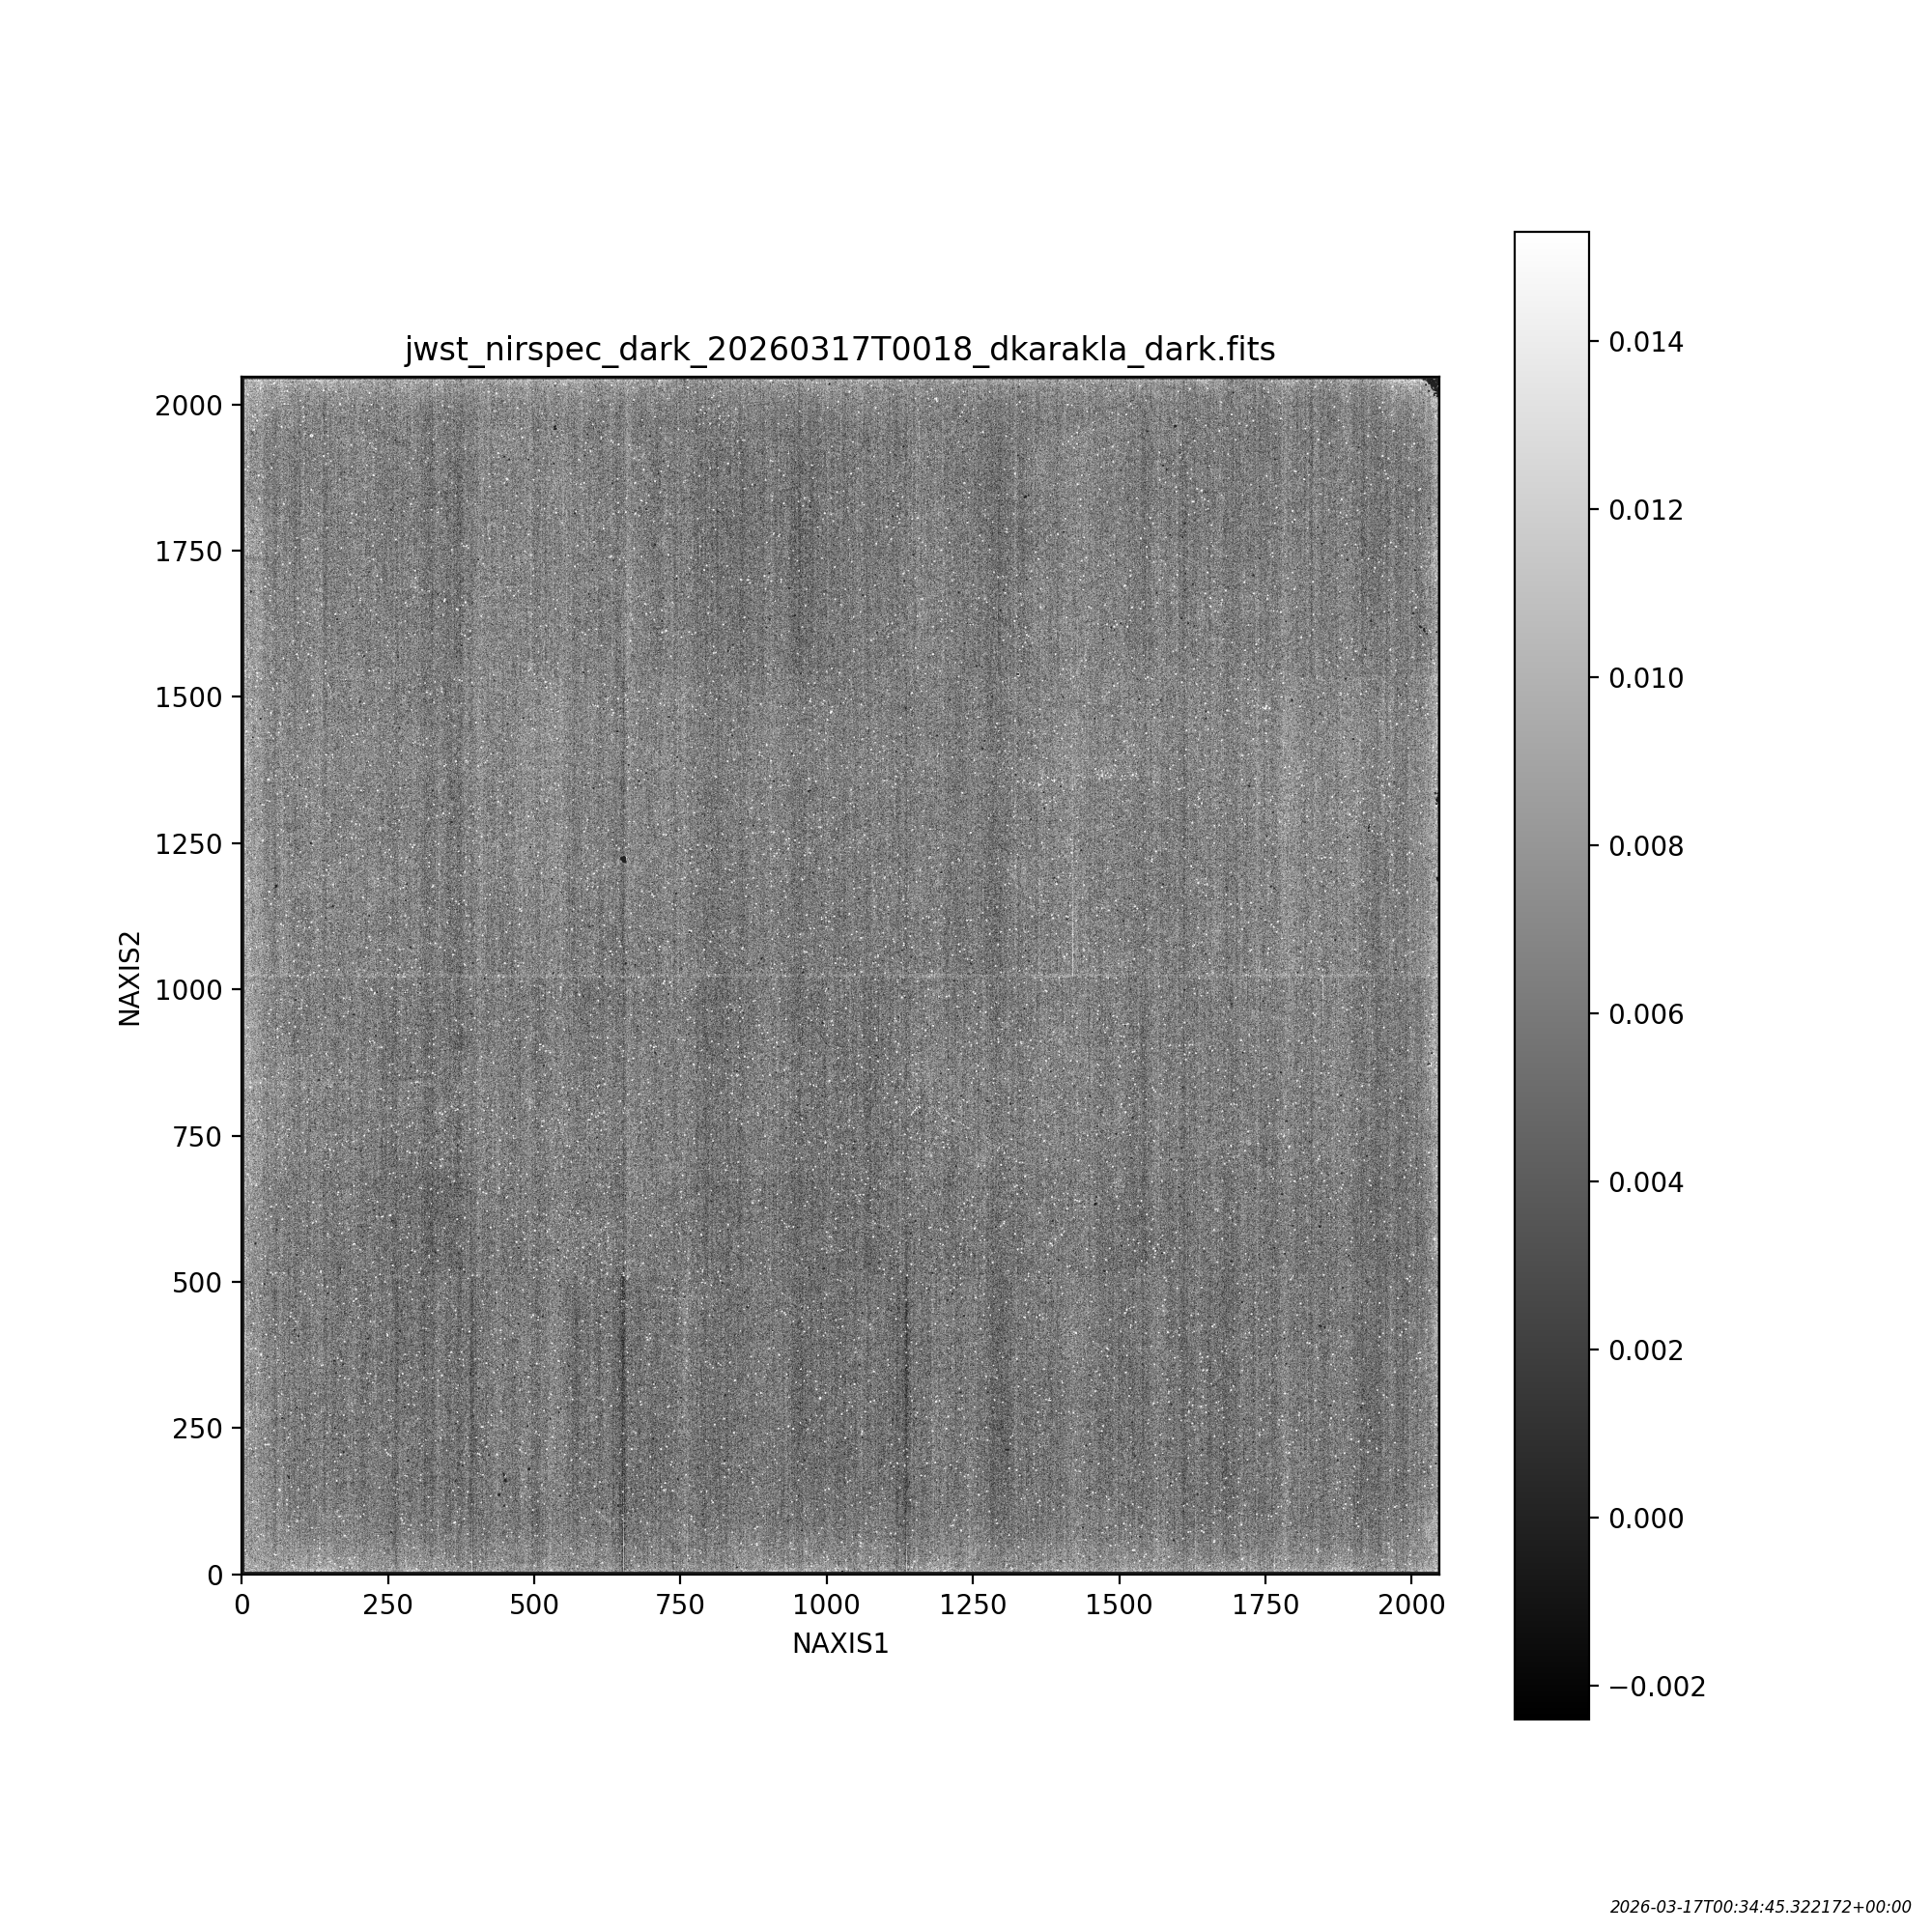
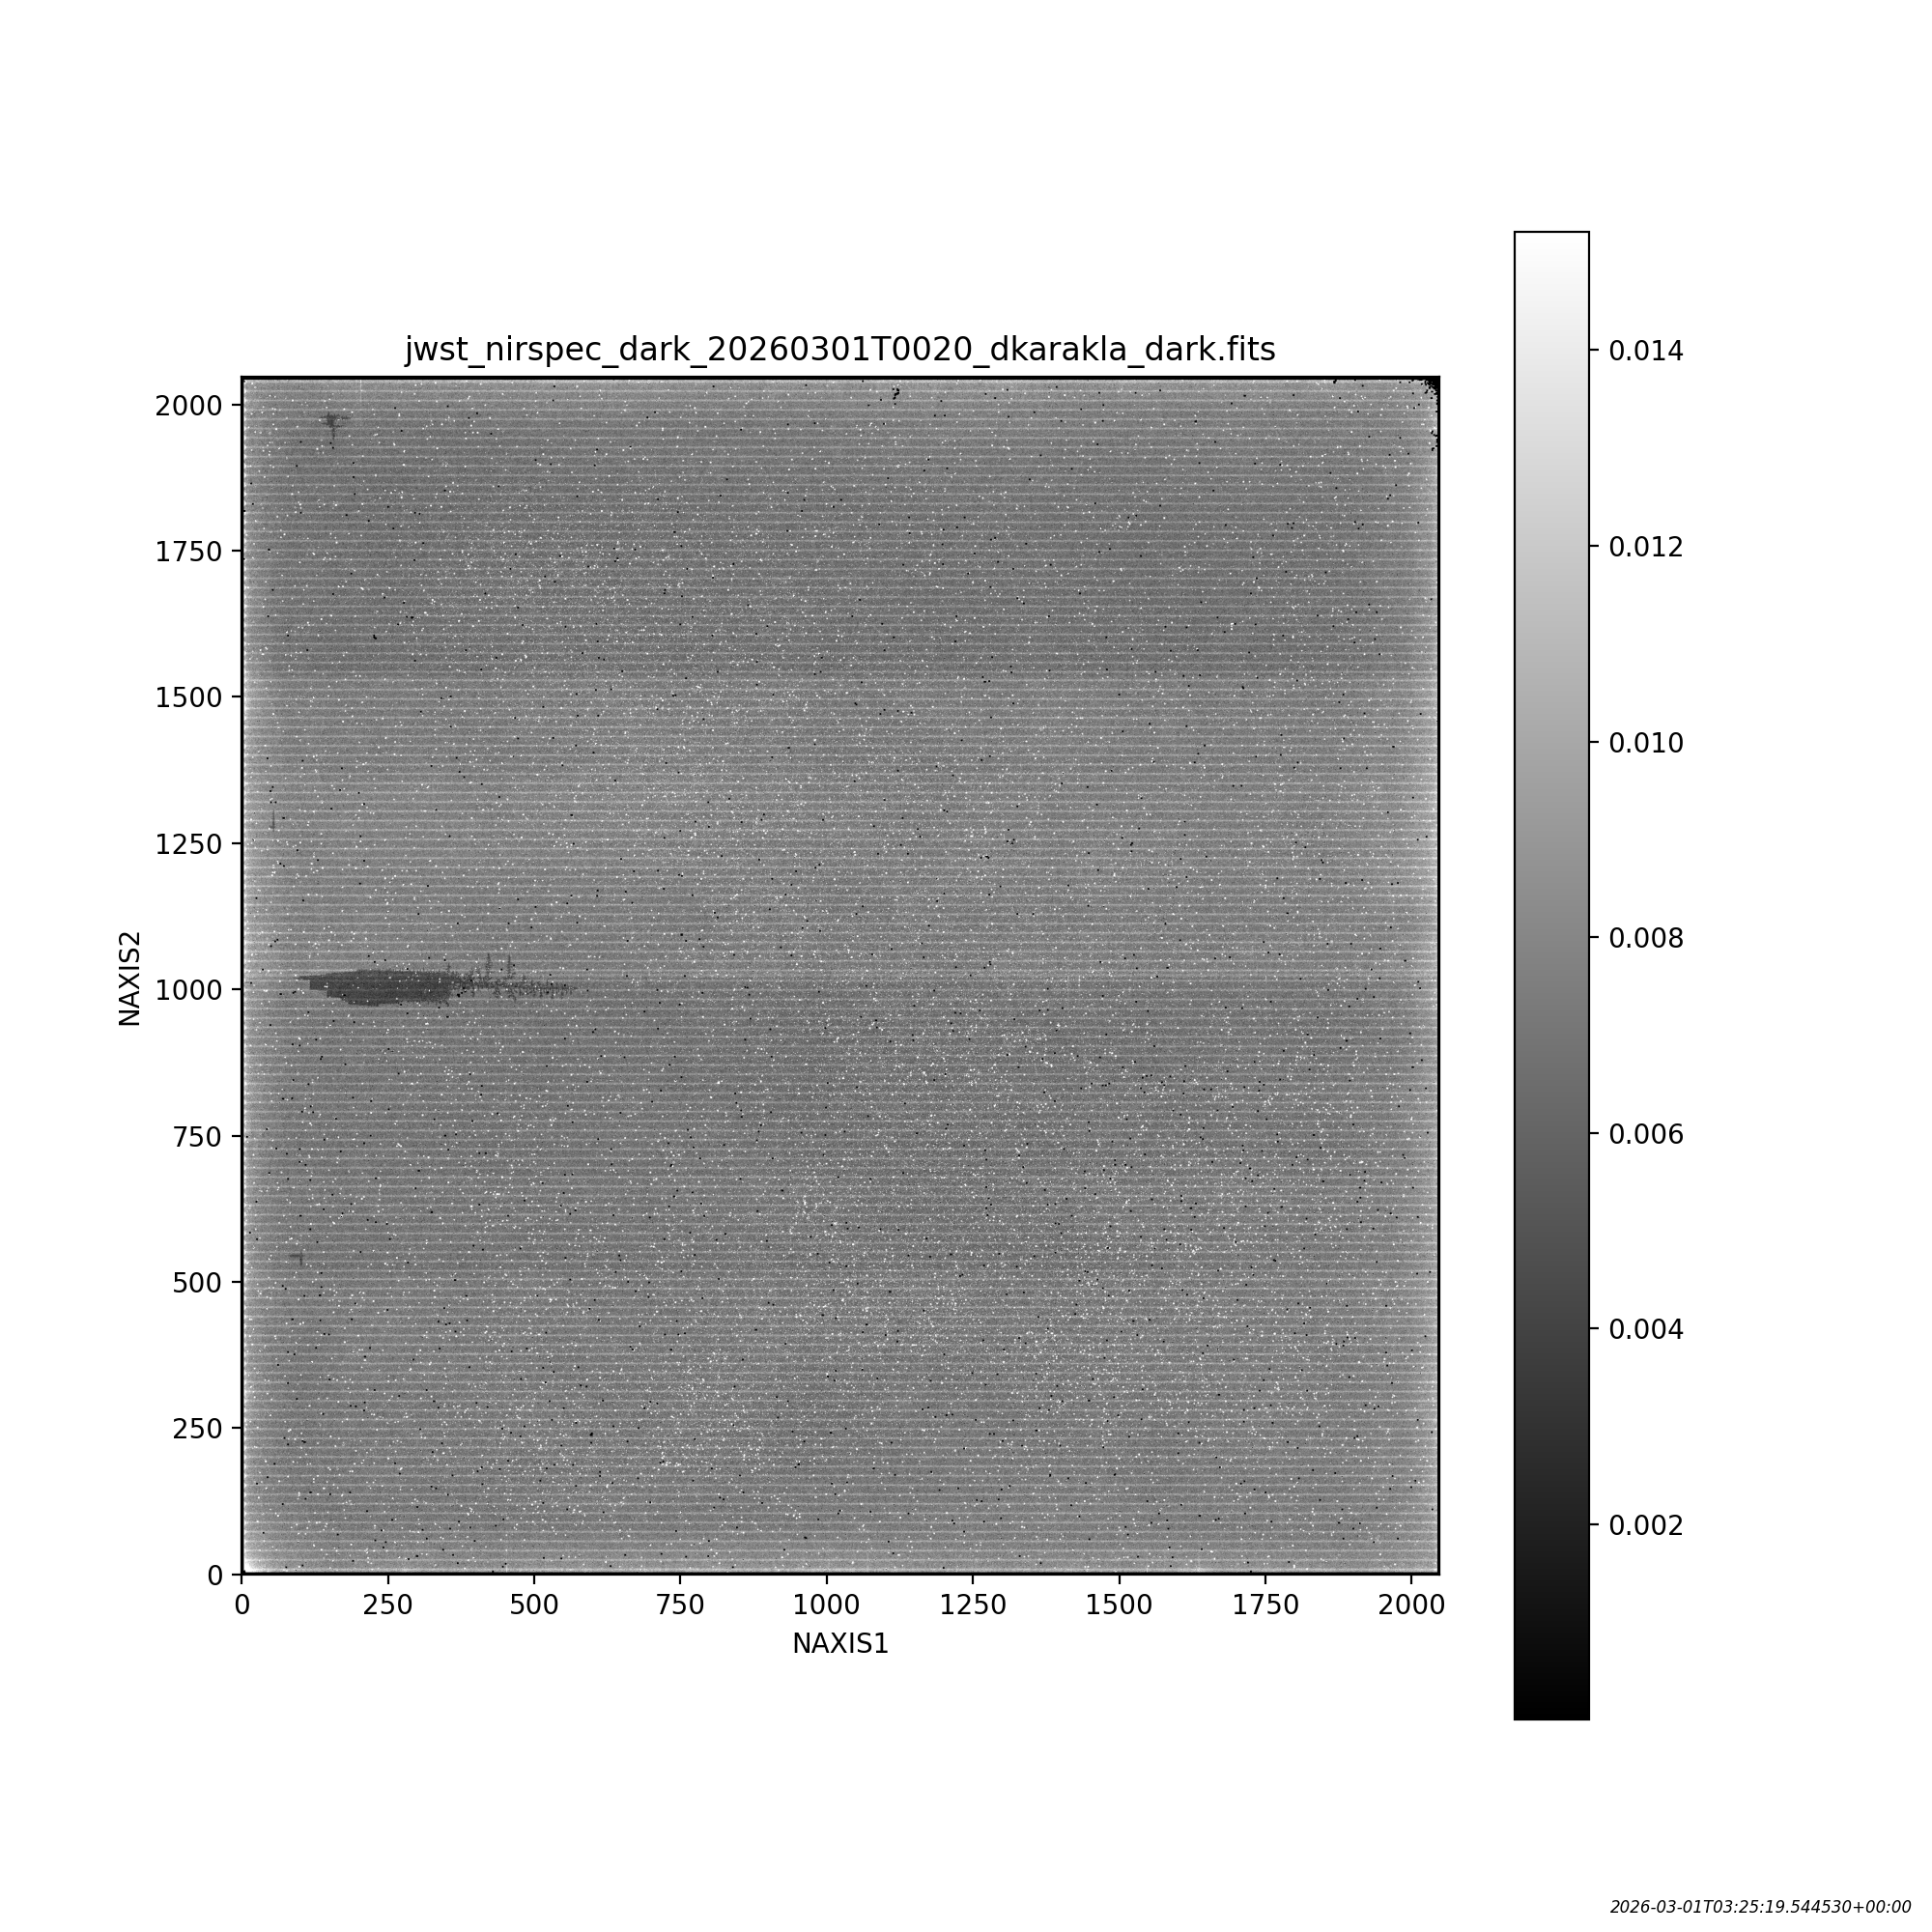
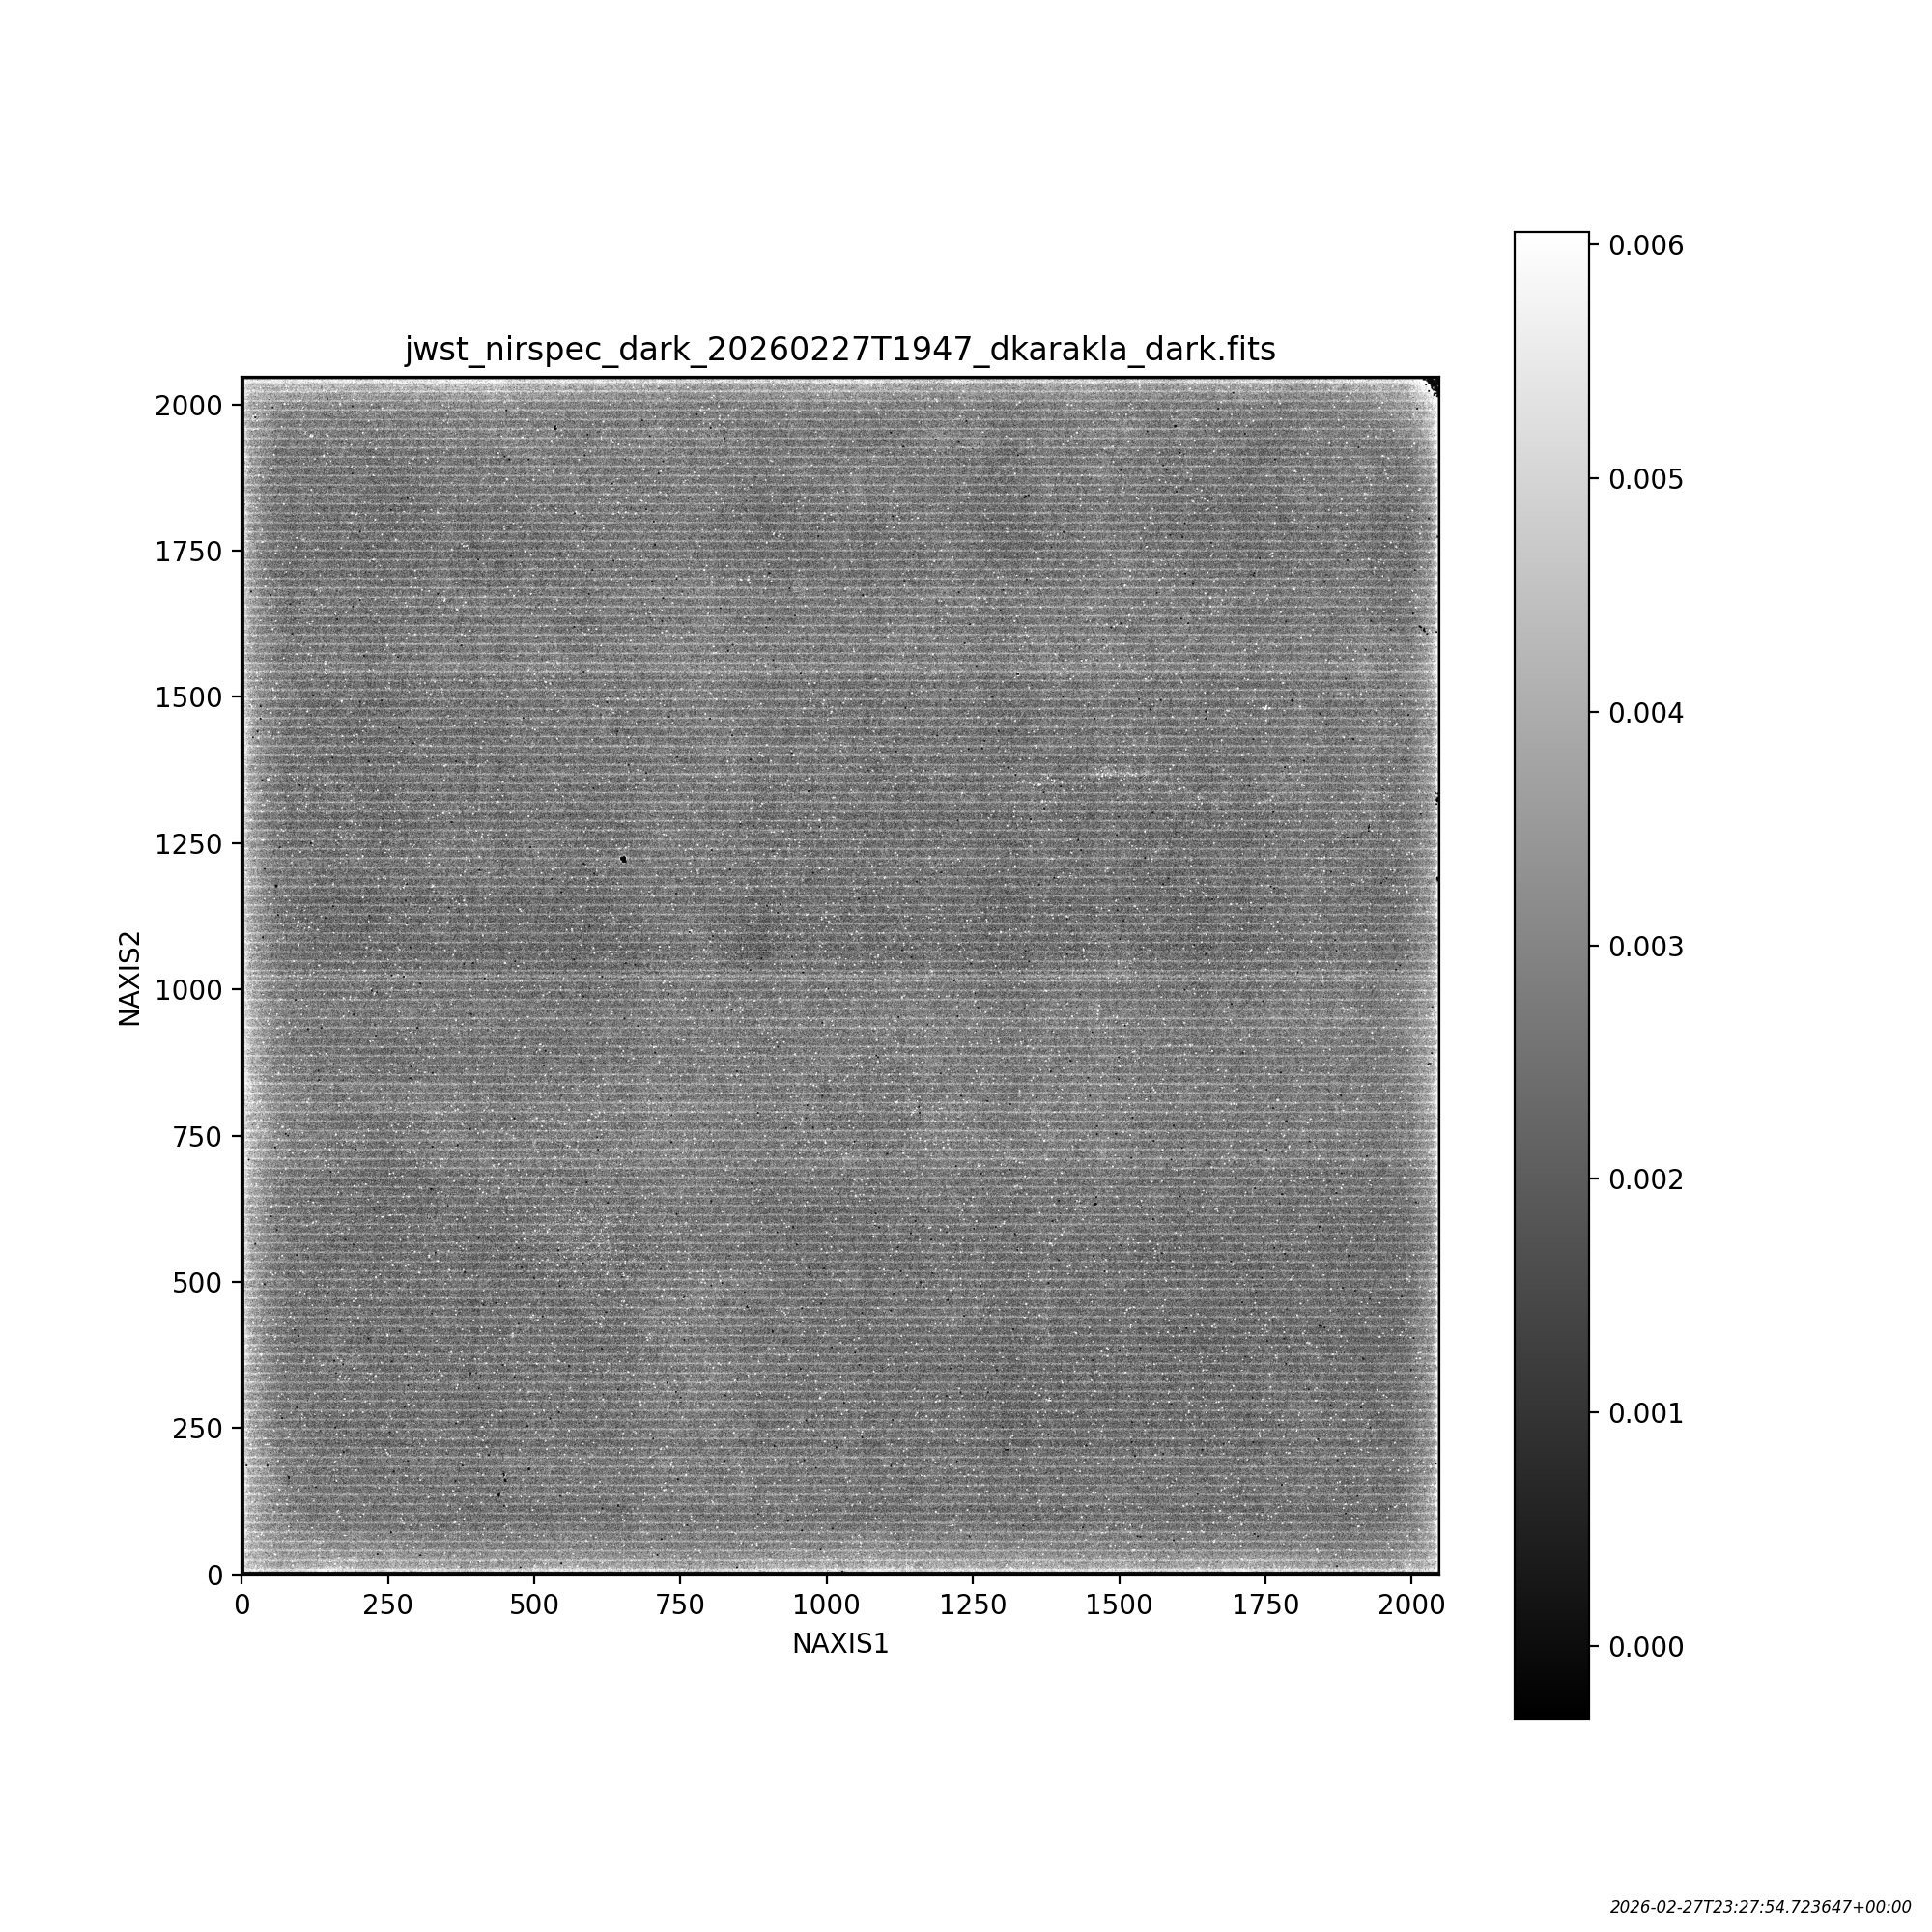
Figure 3. NIRSpec detector dark current images IRS2 readout mode
Click on the figures for a larger view.
The NIRSpec detectors NRS1 (top) and NRS2 (bottom) dark images in IRS2 readout mode, acquired by averaging ten ~49 minute dark exposures. The grey scale indicates the dark signal in e–/s. The median dark signal is 0.008 e–/s for NRS1 and 0.003 e–/s for NRS2. The 1/f striping is significantly reduced wit this readout mode, and the regular horizontal striping is primarily due to reference pixels being read over and over again, a feature of the IRS2 readout mode. These dark reference files are from early 2026 (found in CRDS as jwst_nirspec_dark_0534 (NRS1) and jwst_nirspec_dark_0539 (NRS2)). Similar full frame dark reference files are regularly delivered to CRDS and typically cover a period of 2-3 months each.
Detector read noise
Detector readout noise is measured by computing the correlated double sample (CDS) of many adjacent detector frames and getting the standard deviation for each pixel after performing reference pixel / IRS2 corrections. Using the CDS eliminates the impact of the kTC noise that is always present and results in a changing offset/pedestal for each integration. Using the slope of a ramp after fitting also eliminates the kTC noise. The CDS noise is sqrt(2) times the readout noise for a given pixel. Histograms of the CDS noise for the 2 NIRSpec detectors for traditional full frame mode and IRS2 readout mode as measured during commissioning are presented in Figures 4 and 5 below (Birkmann, S.M. et al., 2022). They are well in agreement (within ~1%) with the CDS noise measured during ground test campaigns.
Figure 4. NIRSpec detector CDS noise histograms for traditional full frame readout mode


Click on the figures for a larger view.
CDS noise in traditional full frame readout mode for NRS1 (top) and NRS2 (bottom) for the 4 detector outputs.
Figure 5. NIRSpec detector CDS noise histograms for IRS2 readout mode.


Click on the figures for a larger view.
CDS noise in IRS2 readout mode for NRS1 (top) and NRS2 (bottom) for the 4 detector outputs. NRS2 exhibits a broader distribution and higher CDS/read noise than NRS1, as was already observed during ground testing.
Detector total noise
Words in bold are GUI menus/
panels or data software packages;
bold italics are buttons in GUI
tools or package parameters.
Figure 6. Effective total noise of the NIRSpec detectors.

The median (of all pixels) effective total noise as a function of integration time for the 2 NIRSpec detectors and different readout modes as measured from dark data obtained during NIRSpec commissioning.
Table 1. Effective total noise of the NIRSpec detectors
| Total Noise† (e-) | ||||
|---|---|---|---|---|
| Readout mode | Detector | Teff ~950 s | Teff ~1700 s | Teff ~ 3560 s |
Traditional Full Frame | NRS1 | 6.9 | 7.4 | N/A |
| NRS2 | 7.3 | 7.7 | N/A | |
IRS2 Full Frame | NRS1 | 5.9 | 6.6 | 8.5 |
| NRS2 | 7.2 | 7.6 | 9.2 | |
Subarray / ALLSLITS | NRS1 | 7.0 | 7.8 | N/A |
| NRS2 | 7.0 | 7.5 | N/A | |
† As measured on-orbit during commissioning, includes effects of cosmic rays after mitigation
Table note: Median effective total noise of the NIRSpec detectors for the different readout modes.
Detector non-linearity
All of JWST's near-infrared detectors exhibit non-linear response, as illustrated below. The thin straight line represents linear flux, the curves present the deviation from this linearity for detector operation at 3 different temperatures as measured on ground. Correction for this detector non-linearity performance is taken into account in the data reduction pipeline.
Figure 7. Example response of detector NRS2

Measured response of the NIRSpec NRS2 detector, showing non-linearity, especially at higher count levels. The curves represent linearity data acquired at 3 different detector operating temperatures. "492" refers to the detector named NRS2, also called "SCA492" in laboratory characterization tests.
Detector saturation
Charge cannot accumulate indefinitely in a single integration; there is a maximum level beyond which the signal saturates or can no longer be reliably corrected for non-linearity. Given the gain values discussed above, the saturation level for most pixels in the NIRSpec SCAs is set by the limit of the analog-to-digital converter: 216−1, or 65,535 DN. Counts at this level must be flagged and rejected by the data processing pipeline to derive the correct count rate (a minimum of 2 unsaturated groups per integration are necessary to recover the count rate). In practice, the saturation thresholds applied by the pipeline are actually below this level, and vary from pixel to pixel, in order to reject data in which the non-linearity is too large to be corrected accurately. The average saturation level is 61,000–64,000 DN. The average detector well depth is the saturation minus the detector bias level: 55,100 and 60,400 electrons for the NRS1 and NRS2 detectors, respectively (Birkmann 2016).
Unlike with a CCD, there is no "bleeding". However, charge diffusion can impact neighboring pixels. This is also known as the "brighter-fatter" effect, see e.g., Plazas et al. 2018. Also, a highly saturated region could result in persistence that affects subsequent exposures at the same detector position. For example, in the case of solar system observations, dither patterns and target orientation should be planned such that a faint satellite does not fall onto a region that was illuminated by the planet in a previous exposure.
Detector quantum efficiency (QE)
The detector quantum efficiency (QE) is a measure of how efficiently a detector captures and records incoming photons. The QE of the NIRSpec detectors was extensively measured at multiple wavelengths during detector system tests carried out in the Detector Characterization Lab (DCL) at NASA Goddard Space Flight Center. The illustration below shows the relative QE for the NRS2 detector at 3 operating temperatures. The gray region represents uncertainty in the measurements, and the orange line presents the performance requirements on the NIRSpec detectors. The NIRSpec NRS1 detector shows a similar QE pattern and amplitude.
Figure 8. QE for NIRSpec detector NRS2

The quantum efficiency for detector NRS2. The gray region shows the estimated error of ±7% and the orange line shows the performance requirements. "492" refers to the detector named NRS2, also called "SCA492" in laboratory characterization tests, and the NIRSpec focal plane assembly (FPA) is designated "106".
Detector persistence
JWST's near-infrared detectors can retain vestiges of earlier exposures; this effect is called persistence. The most vulnerable situation is when a very faint object is observed not long after something very bright. At the present time, the JWST scheduling system does not give an observer knowledge of what may occur in a preceding exposure, in part because that is not always predictable. Figure 5 shows how a persistence signal drops by a factor of ~200 after one hour. The initial persistence level is about 1 e–/s/pix, and, therefore, it is anticipated that the worst effects will be seen from self-persistence within a program.
Figure 9. Persistence for the NIRSpec detectors

Measured persistence (in e¯/s/pixel) for both NIRSpec detectors as signal versus time after a bright (but short) illumination to ~10 times the full well capacity. The measured levels are well below NIRSpec specifications and correspond to a drop by a factor of ~200 in one hour. © Rauscher et al., 2014.
Detector inter-pixel capacitance (IPC)
Inter-pixel capacitance (IPC) is a type of capacitive coupling between neighboring pixels (see Moore et al. 2006). This phenomenon is commonly confused with charge diffusion, which involves migration of charge carriers to adjacent pixel cells which also happens at high signal levels (at or beyond full well). Instead, IPC arises from the interaction of electric fields that alter the measured voltages.
In its simplest form, this effect can be parameterized as a convolution kernel described as a 3 × 3 matrix with values totaling unity. Measurements for NIRSpec detectors show values consistent with an assumption of symmetric coupling: the kernel will have values of nearly zero in the corners, some value α in the left, right, top, and bottom positions, and the remaining 1−4α in the central pixel (α is a coupling coefficient, see Moore et al. 2006). In the NIRSpec SCAs, α ranges from 0.005 to 0.0067. In other words, approximately 2.5%–3% of the total flux measured from a given pixel gets redistributed between its 4 adjacent neighbors.
Uncorrected IPC can affect the spatially measured Poisson noise, which will result in overestimates of the conversion gain and reported quantum efficiencies. Table 2 shows the IPC kernels for the NRS1 and NRS2 detectors of NIRSpec from in-orbit determination during commissioning. This correction is currently not applied in the default data processing pipeline.
Table 2. Inter-pixel capacitance for NIRSpec detectors
| NRS1 | ||
|---|---|---|
| 0.0006 | 0.0057 | 0.0006 |
| 0.0054 | 0.9750 | 0.0054 |
| 0.0006 | 0.0058 | 0.0006 |
| NRS2 | ||
|---|---|---|
| 0.0004 | 0.0049 | 0.0003 |
| 0.0050 | 0.9786 | 0.0051 |
| 0.0004 | 0.0050 | 0.0004 |
The NIRSpec inter-pixel capacitance (IPC) kernel for the NIRSpec detectors NRS1 (left) and NRS2 (right).
Bad pixels
The vast majority of pixels in the NIRSpec detectors are considered operable. Examples for non-operable pixels are pixels which do not respond to light, or exhibit a high dark current signal and thus a high total noise. The number of bad/non-operable pixels in the NIRSpec detectors as measured during commissioning is summarized in Table 3. Note that the bad pixel population is expected to evolve throughout the NIRSpec lifetime, and therefore it is monitored throughout each JWST cycle using dedicated calibration programs. This monitoring has shown that since the end of commissioning, the HOT pixel population in particular has been growing at a steady rate of approx. 100 pixels/month on each of NIRSpec detectors (or 0.03% of all pixels per year).
For up-to-date information on the bad pixel population, users should consult the data quality (DQ) flags in the bad pixel mask and dark reference files in the Calibration Reference Data System (CRDS).
Table 3. Non-operable pixels in the NIRSpec detectors, as measured at the end of commissioning
| Bad pixel type | NRS1 | NRS2 | Comment |
|---|---|---|---|
| DEAD | 7757 | 3938 | Does not respond to light |
| OPEN | 294 | 252 | Very low response, signal mostly ends up in adjacent neighbors (see below) |
| ADJ_OPEN | 1664 | 1216 | Pixel impacted by OPEN neighbor (additional signal) |
| LOW_QE | 1766 | 887 | Low response to light |
| RC | 3908 | 1902 | Large dark signal that is non-linear (RC-like ramp) |
| HOT | 11,171 | 6862 | Hot (dark signal > 1 DN/s) pixel |
| Total bad pixels | 26,560 | 15,057 | Total number of non-operable pixels |
| Operable pixel fraction | 99.36% | 99.64% | Fraction of operable pixels in the 2040 × 2040 pixel active area |
Table note: The number of non-operable pixels of different kinds in the NIRSpec detectors. Hot pixel counts have been updated using dark data from December 2025; all other non-operable pixel categories are assumed to be unchanged since end of commissioning (July 2022). Note that the total number of bad pixels can be less than the sum, as some bad pixels belong to several categories. The fraction of operable pixels is for the 2040 x 2040 pixel active area of the detectors. (see Böker et al. 2023)
References
Birkmann, S.M. et al. 2022 Proc. SPIE, 12180
The in-flight noise performance of the JWST/NIRSpec detector system
Birkmann, S. 2016 ESA-JWST-SCI-NRS-TN-2016-004
NIRSpec Saturation and Non-Linearity Correction Reference Files for Build 7
Böker, T., Beck, T. L., Birkmann, S. et al. 2023, PASP, 135, 1538
In-orbit Performance of the Near-Infrared Spectrograph NIRSpec on the James Webb Space Telescope
Janesick, J. et al. 1987 Optical Engineering, 26(10), 261072
Charge-Coupled-Device Charge-Collection Efficiency And The Photon-Transfer Technique
Quantum efficiency overestimation and deterministic cross talk resulting from interpixel capacitance
Plazas, A.A., et al. 2018, PASP, 130, 988
Laboratory Measurement of the Brighter-fatter Effect in an H2RG Infrared Detector
Rauscher, B.J. et al. 2014, PASP, 126, 739
New and Better Detectors for the JWST Near-Infrared Spectrograph
Regan, M. W. and Bergeron, L. E. 2020, Journal of Astronomical Telescopes, Instruments, and Systems, 6, 016001
Zero dark current in H2RG detectors: it is all multiplexer glow
Sirianni, M. 2016 ESA-JWST-SCI-NRS-TN-2016-013
NIRSpec IPC Kernerl Reference Files for Build 7
Sirianni, M. 2017 ESA-JWST-SCI-NRS-TN-2016-012
NIRSpec Gain and Readnoise Reference Files for Build 7