NIRISS Filters
JWST NIRISS has 12 medium- and broadband filters that cover the wavelength range between 0.8 and 5.0 μm in support of applications involving aperture masking interferometry, wide field slitless spectroscopy, and imaging.
On this page
See also: NIRISS Observing Modes
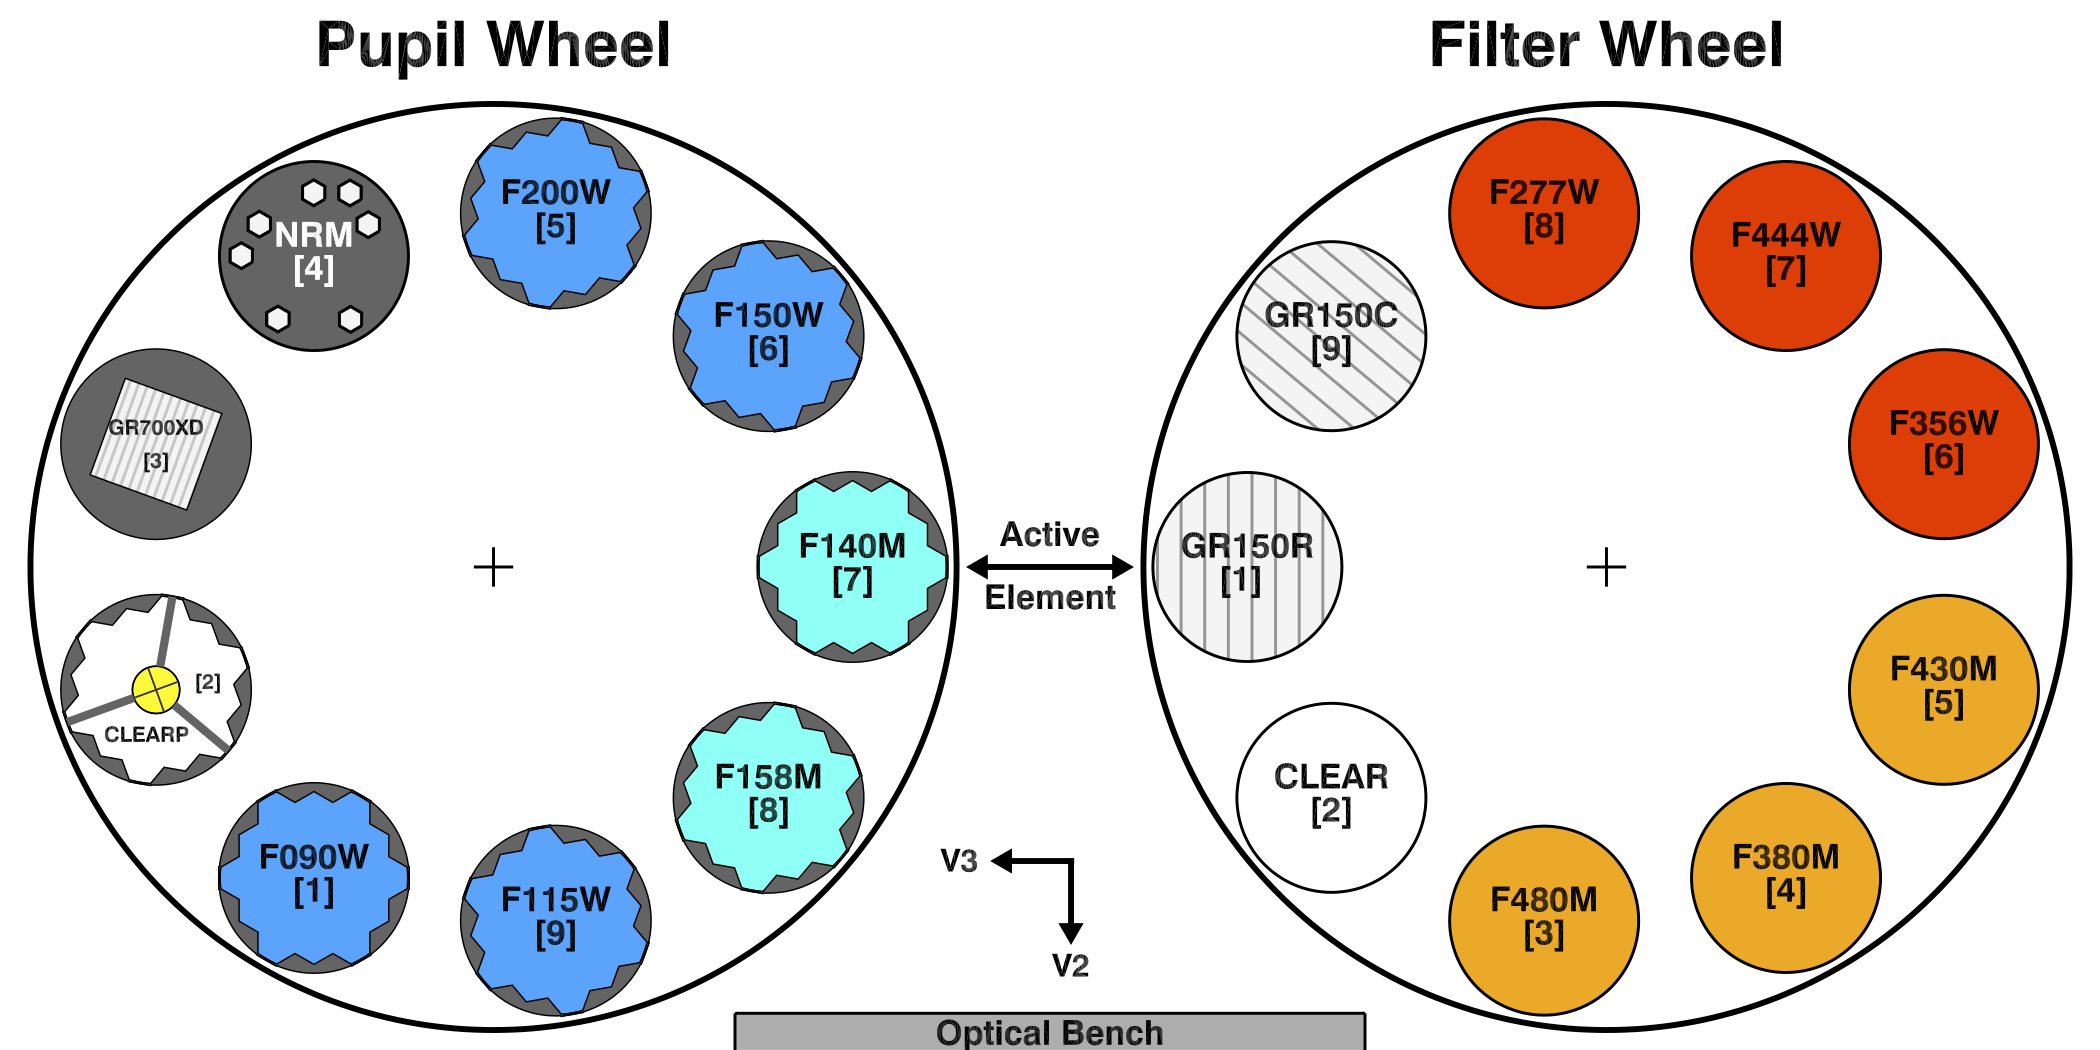
NIRISS has a total of 12 filters, which are located in the NIRISS pupil and filter wheels as shown in Figure 1. The pupil wheel contains 6 short wavelength filters with central wavelengths between 0.9 and 2.0 μm, while the filter wheel has 6 long wavelength filters with central wavelengths between 2.8 and 4.8 μm. When used in combination with other optical elements, these filters support the NIRISS aperture masking interferometry (AMI), wide field slitless spectroscopy (WFSS), and imaging modes.
Historical context
Except for F158M, the NIRISS filters originated as NIRCam "flight spares." Long wavelength filters that populate the NIRISS filter wheel were transferred directly. However, filters with central wavelengths shorter than 2.5 μm required the addition of a "low pass" filter to eliminate "red leaks" inherent in the design of their optical coatings.
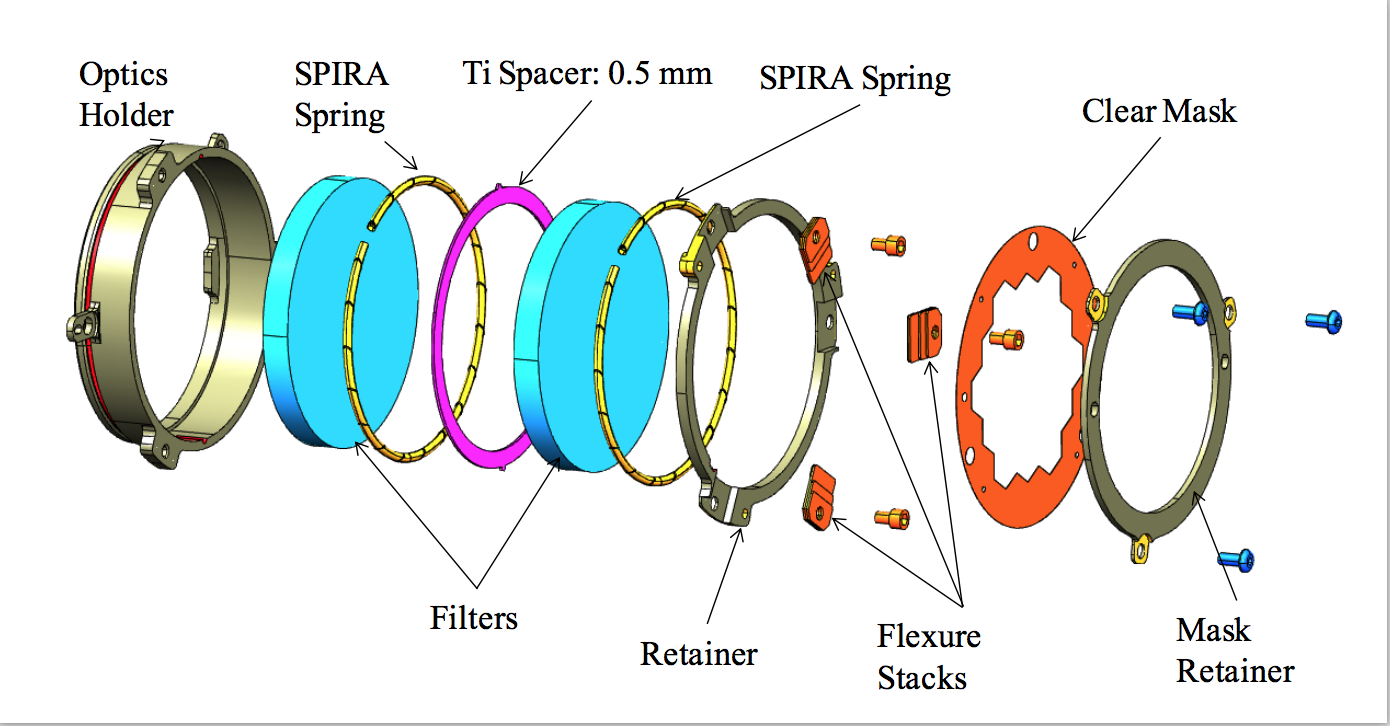
These red leaks (from radiation at wavelengths >2.5 μm) do not affect NIRCam: the short wavelength filters were designed to be used with HgCdTe detectors with a 2.5 μm cut-off, which preclude the detection of photons at longer wavelengths. Since these photons were still detectable by the NIRISS detector (5.2 μm cutoff), the "double-stack" filter design shown in Figure 2 was implemented for all filters in the pupil wheel except F158M. Properties of the low pass filters are included in all estimates of the throughput of the short wavelength "double-stack" NIRISS filters.
As a result of their common heritage, the properties of the NIRISS filters are very similar to their counterparts in NIRCam, even when allowing for the addition of the "low pass" element for the short wavelength filters.
Properties of the NIRISS filters
See also: NIRISS Sensitivity, NIRISS Bright Limits
Figure 3 illustrates the transmission curves for the entire suite of NIRISS filters. Key properties of the filters are quantified in Table 1.
Table 1. Properties of NIRISS filters
| Filter | \lambda_{pivot}~(\mu\rm m)\,^1 | BW (μm)2 | Effective response3 | \lambda_{-} (\mu \rm m)\,^4 | \lambda_{+} (\mu \rm m)^4 | Observing mode |
|---|---|---|---|---|---|---|
| Broadband filters | ||||||
| F090W | 0.901 | 0.194 | 0.880 | 0.796 | 1.005 | WFSS, Imaging |
| F115W | 1.150 | 0.241 | 0.839 | 1.013 | 1.283 | WFSS, Imaging |
| F150W | 1.498 | 0.333 | 0.936 | 1.330 | 1.671 | WFSS, Imaging |
| F200W | 1.984 | 0.461 | 0.945 | 1.751 | 2.226 | WFSS, Imaging |
| F277W | 2.771 | 0.717 | 0.873 | 2.413 | 3.143 | AMI, Imaging |
| F356W | 3.592 | 0.922 | 0.900 | 3.140 | 4.068 | Imaging |
| F444W | 4.434 | 1.121 | 0.858 | 3.880 | 5.023 | Imaging |
| Medium-band filters | ||||||
| F140M | 1.405 | 0.147 | 0.900 | 1.331 | 1.480 | WFSS, Imaging |
| F158M | 1.583 | 0.197 | 0.871 | 1.488 | 1.688 | WFSS, Imaging |
| F380M | 3.825 | 0.205 | 0.864 | 3.726 | 3.931 | AMI, Imaging |
| F430M | 4.285 | 0.203 | 0.793 | 4.182 | 4.395 | AMI, Imaging |
| F480M | 4.815 | 0.298 | 0.689 | 4.668 | 4.971 | AMI, Imaging |
1 The pivot wavelength, \lambda_{pivot}, relates the flux per unit wavelength (F_\lambda) to the flux per unit frequency (F_\nu). It is defined as: \lambda^2_{pivot} = {\int{ \lambda T(\lambda)\, \rm{d}\lambda}}\,\, / \,\,{\int{ \left(T(\lambda)\,/\,\lambda \right)\, \rm{d}\lambda}}, where T(\lambda) is the filter transmission curve.
2 The bandwidth BW is the integral of the filter transmission curve normalized by the maximum transmission (T_{max}): BW = \int T(\lambda) \,{\rm d}\lambda\,\, /\,\, {T_{max}}.
3 The effective response is the mean transmission value over the wavelength range of \lambda_{pivot} \pm BW / 2.
4 The short (\lambda_{-} ) and long (\lambda_{+}) half power wavelengths of a filter are the wavelengths at which its transmission falls to 50% of its peak value.
Table 2. NIRISS filter zero points
| Filter | m0,Sirius1 | F0 (Jansky) | ΔmAB2 |
|---|---|---|---|
| Broadband filters | |||
| F090W | 27.43 | 2321 | 0.49 |
| F115W | 27.22 | 1797 | 0.76 |
| F150W | 26.69 | 1206 | 1.20 |
| F200W | 26.14 | 767 | 1.69 |
| F277W* | 25.56 | 433 | 2.31 |
| F356W* | 25.11 | 272 | 2.82 |
| F444W* | 24.59 | 183 | 3.24 |
| Medium-band filters | |||
| F140M | 26.01 | 1318 | 1.10 |
| F158M | 25.84 | 1093 | 1.30 |
| F380M* | 23.25 | 237 | 2.96 |
| F430M* | 22.80 | 192 | 3.19 |
| F480M* | 22.67 | 155 | 3.43 |
1 The magnitude zero points in NIRISS filters are equivalent to the previous "Vegamag" system where the Sirius CALSPEC model of Bohlin 2022 is used as a template for an average A0V star with a magnitude of -1.395 in all filters (Rieke et al 2022).
2 Magnitude offset to convert filter zero points from the Sirius system to the AB magnitude system, i.e., mab = m0,Sirius + ΔmAB.
*Note that the filters in the Filter Wheel are assumed to be crossed with the CLEARP filter in the Pupil Wheel and thus suffer a loss of throughput of 16% due to the pupil alignment reference (PAR). These filter zero points would be inappropriate if they were crossed with the NRM for the AMI mode.
NIRISS system throughput
Figure 4 shows the net photon-to-electron conversion efficiency (PCE) for each of the NIRISS filters. These values were estimated by combining the current understanding of the throughput of the JWST Optical Telescope Element (OTE), the internal optical properties of NIRISS, and the quantum efficiency of the NIRISS detector. At any epoch, these effects are taken into account by the JWST Exposure Time Calculator (ETC). Although Figure 4 is useful for "back-of-the-envelope" calculations, critical applications should use the ETC to derive definitive estimates of performance.
NIRISS filter color corrections
Color corrections are provided to convert from reported flux density to actual flux density for a representative range of spectral energy distributions (SEDs), including stellar SEDs, blackbody SEDs at various temperatures, and SEDs that follow a power law spectrum. Several parameters are provided, including:
- "Optical" color correction: flux density at the reference wavelength divided by the photon weighted mean flux density.
- "Infrared" color correction: flux density at the reference wavelength divided by the flux density at this wavelength for the standard spectral shape (\lambda F_{\lambda}= constant) that gives the same signal.
- Infrared "K" color correction: the inverse of the multiplicative "infrared" color correction, following the convention of IRAS and WISE.
- "Conversion factor": the ratio of the "infrared" standard spectral shape flux density value to the photon weighted mean flux density value.
Two methods were employed to calculate the color corrections. For the "optical" convention, the photon weighted mean flux density is calculated from the total photon conversion efficiency values as per equation (A2) in Bohlin et al. (2011). This value is compared with the interpolated actual flux density at the pivot wavelength. The ratio is the color correction.
For the "infrared" convention, the photon weighted mean flux density for the source spectrum is used as the normalization value at the pivot wavelength to make a template spectrum with the standard spectral shape. A new calculation of the photon weighted mean flux density is carried out with this scaled template spectrum. The ratio of the photon weighted mean flux density of the template spectrum to the photon weighted mean flux density from the source spectrum is used to scale the template spectrum. The ratio of the interpolated flux density at the pivot wavelength for the source spectrum to that for the rescaled template spectrum is the color correction.
It is the responsibility of the user to determine whether a color correction, and which color correction, is necessary for their science goals. The pre-calculated color corrections for a range of representative SEDs can be downloaded.
Ancillary data
NIRISS transmission and net throughput curves may be downloaded: niriss_filter_tarball.tar. Please see the accompanying "ReadMe" file for further information about this distribution.
References
Bohlin, R. C., Gordon, K. D., Rieke, G. H., 2011, AJ, 141, 5
Absolute Flux Calibration of the IRAC Instrument on the Spitzer Space Telescope Using Hubble Space Telescope Flux Standards
Rieke, G., H., Su, K., Sloan, G., C., Schlawin, E., 2022, AJ, 163, 45
Infrared Absolute Calibration. I. Comparison of Sirius with Fainter Calibration Stars


