Shower and Snowball Artifacts
Data artifacts known as snowballs (in the near-IR) and showers (in the mid-IR) are caused by large cosmic ray impacts that affect hundreds of pixels (M. Regan 2023).
On this page
The vast majority of cosmic ray impacts directly affect only one or 2 pixels. However, snowballs and showers are sometimes seen in data. In the near-IR detectors, snowballs tend to be circular, while in the mid-IR detectors showers often have elongated and irregular shapes.
A very rough estimate of the rate is around one snowball every 20 s in each 2K × 2K near-infrared detector, with approximately a factor of 2 lower rate of occurrence for shower events in the mid-IR. This frequency is highly variable however, with some observations affected by large numbers of such artifacts and other observations nearly completely unaffected. While similar events were seen in the near-IR detectors on the ground, the typical frequency was an order of magnitude lower and the amount of charge deposited was also significantly smaller.
Words in bold are GUI menus/
panels or data software packages;
bold italics are buttons in GUI
tools or package parameters.
As of jwst pipeline version 1.8.0 the jump step in the pipeline has been updated to detect and flag pixels affected by both showers and snowballs, although work is ongoing to improve the performance of this step. This option is generally turned off by default as of build 10.1, and is being gradually enabled mode by mode following successful testing. Users can toggle this step for themselves in offline reprocessing using the find_showers (mid-IR) and expand_large_events (near-IR) parameters respectively (see the ReadTheDocs Jump Detection page.)
Showers
In the mid-IR, shower artifacts are thought to result from large clusters of energetic particles produced by cosmic rays. Unlike traditional cosmic rays, which affect a small number of pixels and produce a nearly delta function jump in the ramp for a given pixel, these cosmic ray showers can affect hundred of pixels (see Figure 1), release charge slowly over a period of many seconds, and can produce latents visible in the next integration. In some cases the initial event that caused the shower can take place while the detector was in idle mode before the integration began. These showers are found in both the SHORT and LONG detectors of the MRS, and can sometimes limit the depth of long observations. As illustrated by Figure 1 however, showers can be strongly time variable and (likely) dependent on the solar weather, with some deep exposure nearly free of shower artifacts and others significantly affected.
Cosmic ray showers can be mitigated by dithering and taking at least 3 integrations, while 5 or more will provide better results. However, this may not be practical in general since (for pixels not affected by showers) significantly better SNR is achieved using a small number of relatively long ramps rather than multiple short ramp exposures. Additional algorithms have also been introduced into the jump step of the JWST pipeline that can help to flag and remove these features (see in particular the find_showers parameter). These algorithms can often reduce the impact of showers on deep observations (see Figure 2); work is ongoing to improve their performance in the limit of the most severely-affected exposures.
Click on the figure for a larger view.
Shower events can be strongly time variable; left and right panels show "rate" files (measured in DN/s) for extremely deep SLOWR1 observations with the MRS SHORT detector. While the data on the left is nearly unaffected by showers, the data on the right is dominated by multiple strong shower artifacts.
Click on the figure for a larger view
The pipeline find_showers option allows additional flagging and removal of showers artifacts. Left and right panels show an example "rate" file (measured in DN/s) for the MRS SHORT detector before and after shower correction; this correction removes smaller shower artifacts effectively and can minimize larger artifacts (although cannot always remove them entirely).
Click on the figure for a larger view
Images of a calibration star from commissioning activity PID 1023 - Observations 13 (left) and 14 (right), part of a dithered sequence. The right image shows the appearance of cosmic shower artifacts in the detector image—an elongated structure in the centre right of the image as well as several more spherical “showers" that are not part of the sky image towards the upper left and lower right of the image. The high power cosmic ray also pulls up the value of the entire row in which it hit the detector. Images are taken at 5.6 μm and processed to level 2a in the pipeline with flux units of DN/s. © Dicken et al. 2024.
Snowballs
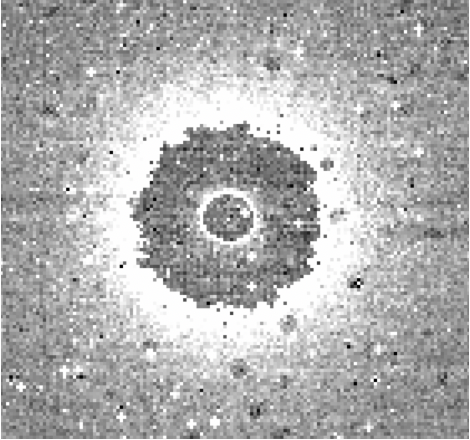
Figure 4 shows a close-up of a slope image (generated in stage 1 detector processing) centered on the location of a very large snowball. This slope image is from a long NIRSpec dark exposure and is very sensitive to any perturbation in the calculated slope. Thus, this is a worst case example; images with significant background rates will see much smaller effects.
- The central region inside the white circle indicates pixels that saturated when the particle hits the detector.
- The white ring of pixels just outside of the saturated pixels represents pixels that saw a discontinuity in the count rate when the event occurred but did not saturate. The discontinuity was flagged as a "jump" by the pipeline and was not included in the slope calculation. They show the excess slope due to charge spilling from the saturated region in subsequent groups of the integration.
- The large darker region outside the white ring is caused by pixels that were flagged as a jump when the snowball occurred but then had below average count rates because photoelectrons were temporarily trapped by small defects in the detector pixels.
- Finally, the outer white halo represent pixels that saw an increase in the accumulated charge when the snowball event occurred but were uncorrected because the increase was below the pipeline's detection threshold.
Although the halo regions are clearly indicated in dark exposures, they could be masked in images with significant astrophysical or other backgrounds.
References
Regan, M. 2023, JWST-STScI-008545
Detection and Flagging of Showers and Snowballs in JWST
Dicken, D. et al. 2024, in prep


