ExoCTK Exoplanet ETC, PandExo
PandExo, the Exoplanet Exposure Time Calculator (ETC), used for planning JWST exoplanet observations, provides a framework for performing calculations that help users optimize their observations of transiting exoplanet.
On this page
See also: JWST Exposure Time Calculator Overview
When preparing JWST proposals for transiting exoplanet science, a crucial part of the process is determining the exposure parameters and optimal instruments that are needed to successfully perform detections of the sought-after atmospheric features.
Although the JWST Exposure Time Calculator provides a framework to estimate signal-to-noise ratios (SNRs) for the different instrument configurations offered by JWST, the transformation of these to actual observables of interest for transiting exoplanet science, such as transit or eclipse depths, is non-trivial. These transformations depend on, among other things, the actual orbital parameters of the exoplanet under study and the total number of integrations in a given exposure.
PandExo, the Exoplanet ETC, (Batalha 2017) provides a simple interface to perform these calculations in order to aid exoplanet observers with their proposal planning. The tool makes use of the latest version of Pandeia to perform the SNR calculations, which, in turn, are used to estimate the expected precision on observables of interest.
The web-based version of PandExo, which is part of the STScI's Exoplanet Characterization ToolKit (ExoCTK) suite of web-based services. PandExo is also available as a python library, which is recommended for performing a large (>10) number of sequential runs.
Using the web interface
Words in bold are GUI menus/
panels or data software packages;
bold italics are buttons in GUI
tools or package parameters.
Under Name, provide a name that will act as an identifier for the PandExo run.
Next, define the properties of the exoplanet (such as the planetary radius and the transit duration) and its host star (such as the stellar effective temperature, radius, metallicity, log-gravity and apparent magnitude) in their respective fields. Alternatively, you can directly query these properties from exo.MAST by entering the name of the exoplanet under Target Name and clicking the green Resolve Target button; this will then fill the properties of the exoplanet under study if they are available — the user can then decide to use the retrieved properties or change subsets of them as desired.
The user then needs to define a stellar spectrum model in the Stellar Model section. Here, they can either use the closest Phoenix model (Husser et al. 2013) to the previously-entered stellar properties by selecting Get Default From Phoenix, or upload a stellar model spectrum by selecting User Defined Stellar Spectrum.
Similarly, for Planet Model, the user can select a planetary model:
- Constant Value: The transit or eclipse depth (for the latter, the estimated temperature of the planet's dayside has to be provided) will be assumed to be constant over the entire wavelength range.
- Upload Spectrum: The user can upload their own transit or eclipse model spectrum.
- Select From Grid: The user can select one of the Fortney et al. (2010) models as inputs to PandExo (for details, see the ExoCTK Forward Modeling Tool article).
Finally, in the Baseline section, the user must define the length of out-of-transit observing time to be spent on the target and the number of transits/eclipses to be observed under Number of Transits. An example of the webpage and all these inputs are shown in Figure 2.
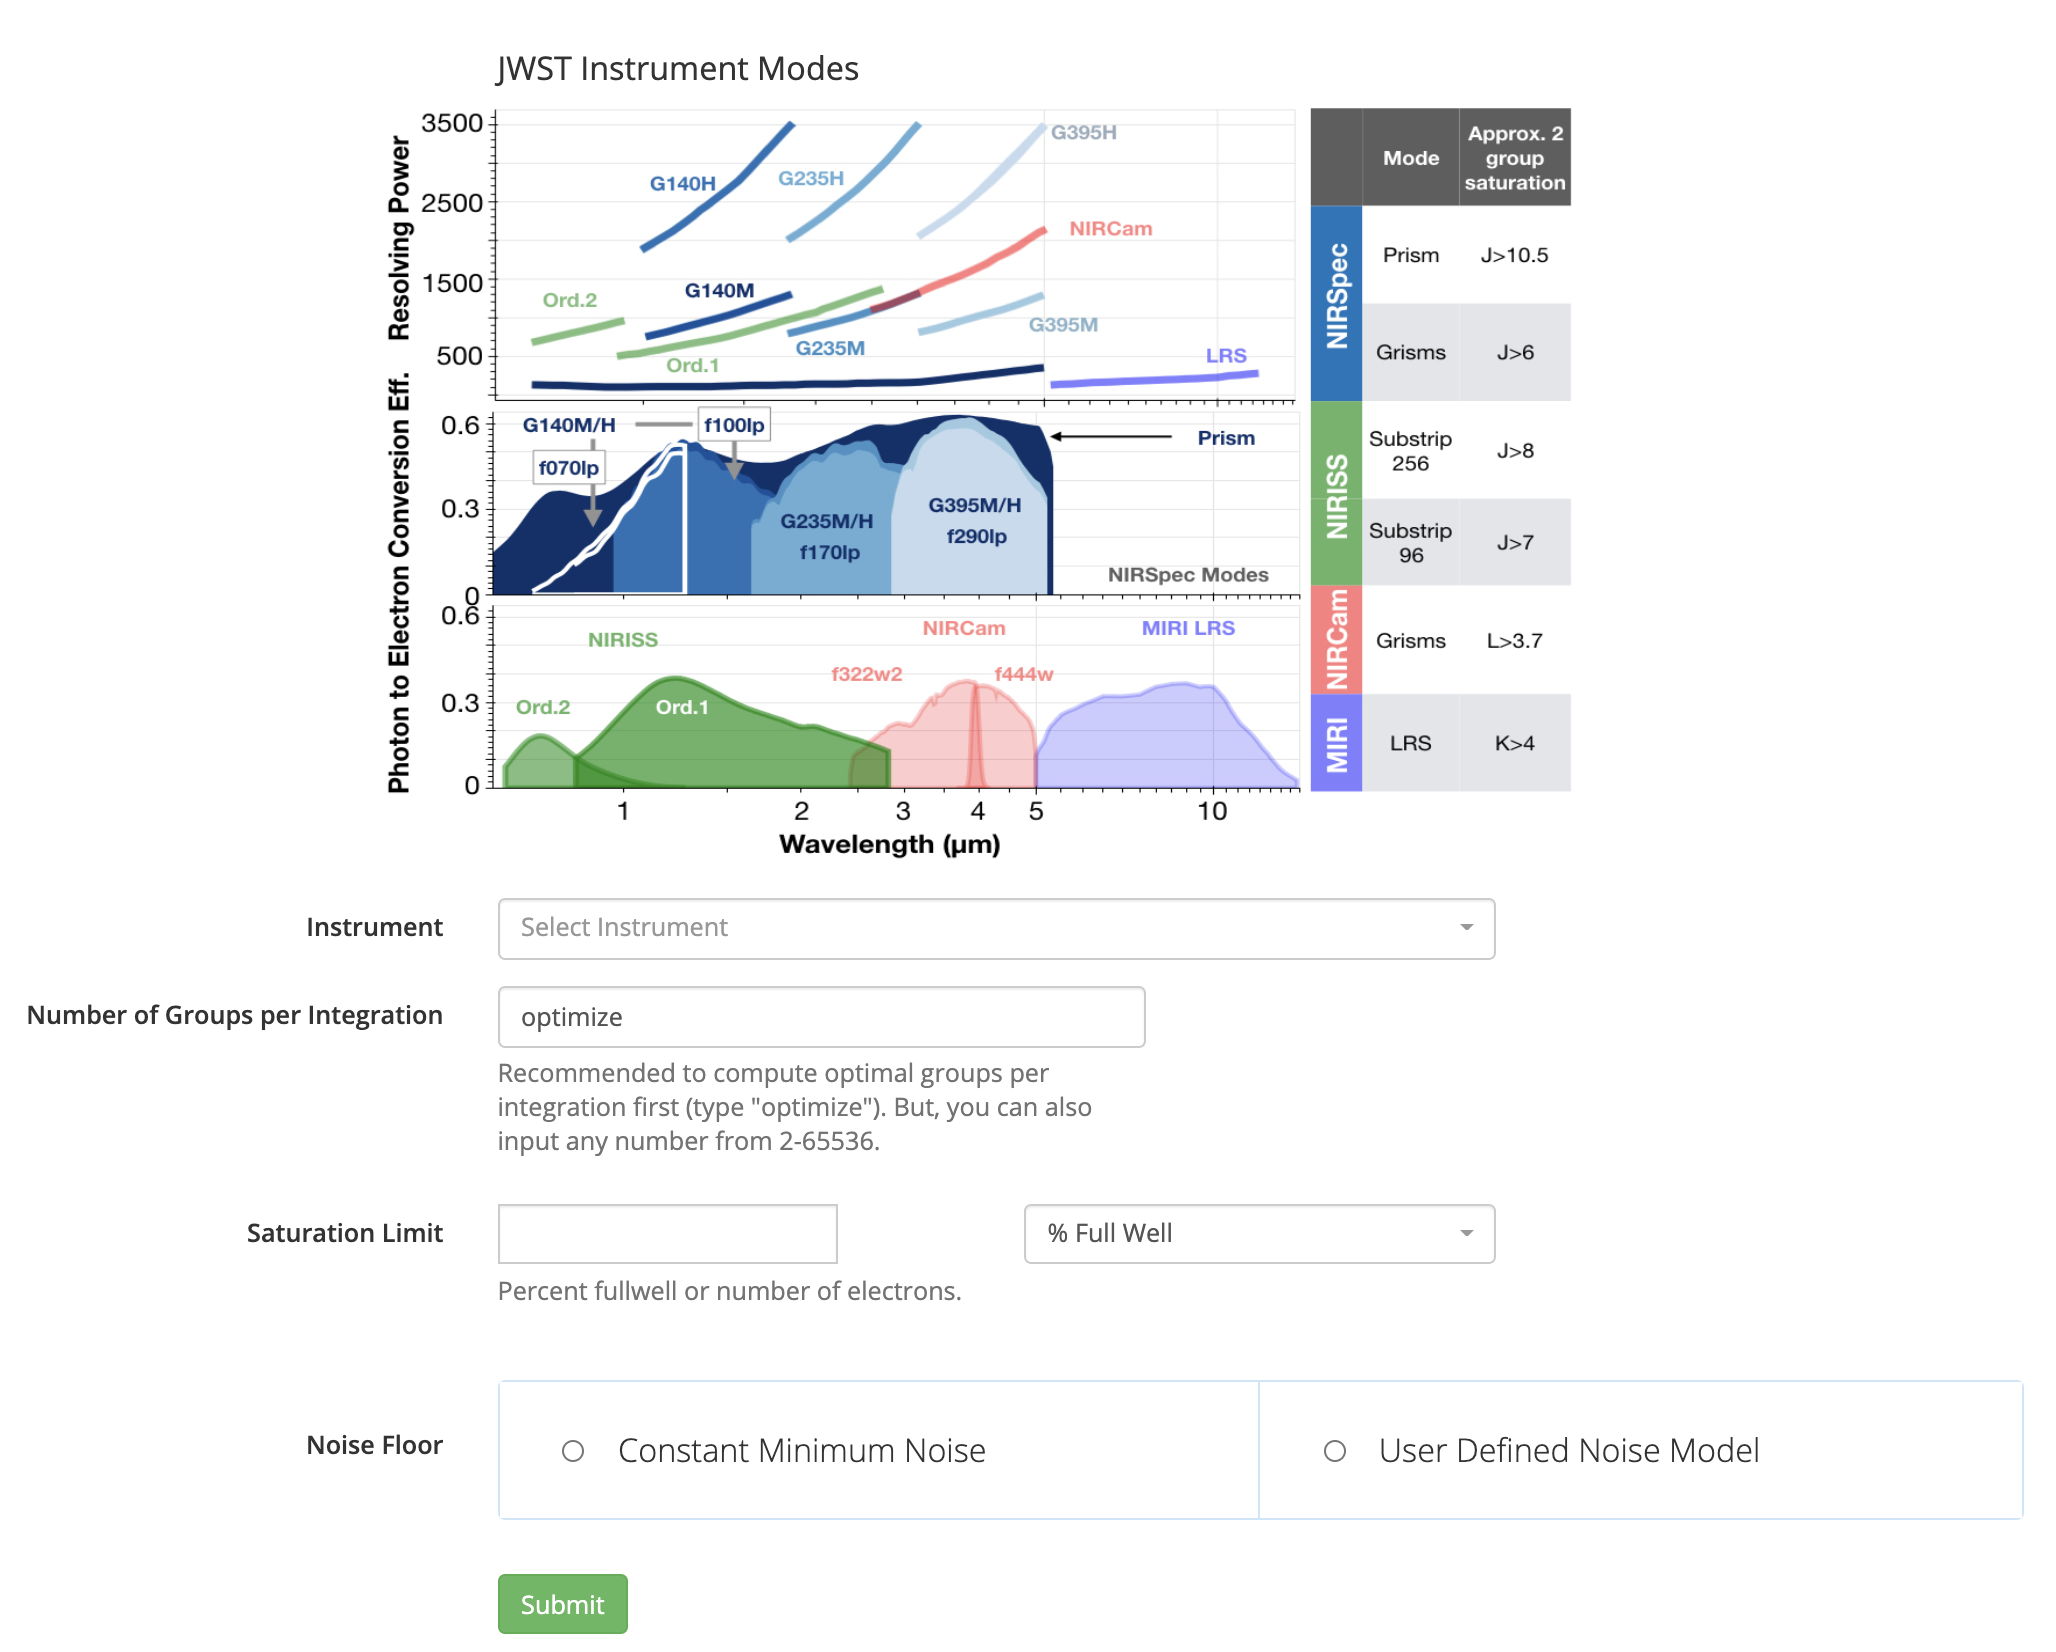
In the Instrument section, the user defines the instrument, modes, and dispersers they will be using for the PandExo run.
In the Number of Groups per Integration field, enter either the number of groups per integration or simply use the default value, optimize, so the tool will optimize this number for maximum observational efficiency.
Under Saturation Limit, define either a percentage or total number of electrons that will be used as saturation by PandExo. Note the percent full well is, in reality, the signal limit defined in the Time Series Observations (TSO) Saturation article.
Finally, the user can also define a maximum achievable precision level under Noise floor; this can be defined as constant across the entire wavelength range by selecting Constant Minimum Noise or the user can upload their own model under User Defined Noise Model.
Exploring PandExo results
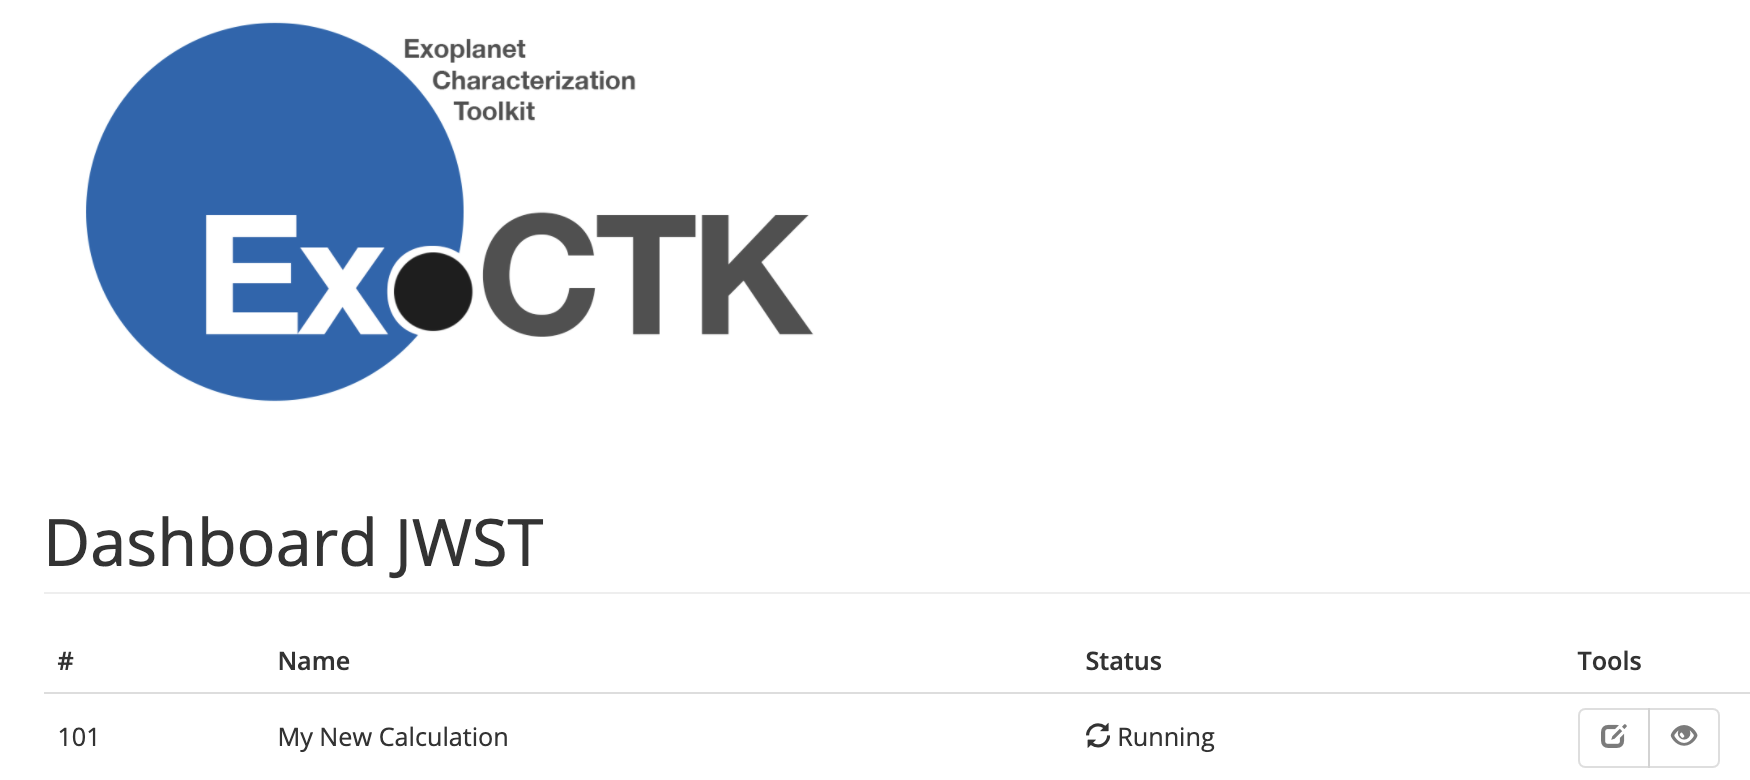
Once the run has finished, and after clicking the "eye" button on the right in the dashboard, the user will be redirected to the pages showing the results of the PandExo runs. The first set of results shown by the tool are a set of 1-D plots, which will look similar to the one in Figure 5 that shows example results of a PandExo run for transmission spectroscopy using the exoplanet HAT-P-1b with the NIRISS SOSS instrument.
It is important to note that the SNR per integration shown by PandExo might be slightly higher than some SNR per integration values estimated by the JWST Exposure Time Calculator. The reason for this is that this latter tool for non-TSO modes includes an additional noise term due to flat field errors, which will most likely not be important for most transiting exoplanet observations due to the relative nature of these measurements. (See the JWST ETC Residual Flat Field Errors article for more details.)
PandExo also presents some 2-D images that are useful for inspecting the overall distribution of flux, SNR and saturation across the detector. Figure 6 shows an example for NIRISS SOSS.
The tool then presents the inputs used for the calculation under the "Table of Original Inputs" (not shown), and, finally, two tables summarizing the results: one with timing information ("Timing Info"), which includes valuable information to be entered in the Astronomer's Proposal Tool (APT), and one with a set of warnings ("Warnings"), which report various details to pay attention to on the current PandExo run, shown as an example in Figure 7.
The table under "Warnings," on the other hand, present a set of checks PandExo performs in order to inform the user if any limits in terms of number of groups, non-linearity regimes, saturation regimes and/or closeness to the signal limits are either being crossed or close to being crossed. Depending on the messages, the user might consider rerunning the calculation with a different instrument, mode and/or target. For optimal decision making on these later warnings, users should follow the recommendations provided by the different JWST instrument teams. Information relevant to saturation and number of groups to choose in the context of TSOs can be found on the JWST Time-Series Observations TSO Saturation article.
Finally, the user can download the results of the PandExo run to their local machine by clicking on the Download Data button at the bottom of the results page. This is a "pickle" file that can be opened using Python's pickle library. The file contains a Python dictionary with all the details about the results of the run. For a full description of each of the keys of that dictionary, see the relevant PandExo ReadTheDocs article.
References
Batalha, N. E., et al. 2017, PASP, 129, 976, 064501.
PandExo: A Community Tool for Transiting Exoplanet Science with JWST & HST
Husser, T.-O., et al. 2013, A&A, 553, 6, 9.
A new extensive library of PHOENIX stellar atmospheres and synthetic spectra
Kurucz, R. L., 1979, ApJS, 40, 1-340.
Model atmospheres for G, F, A, B, and O stars. http://kurucz.harvard.edu/grids/


