NIRISS Target Acquisition
An onboard target acquisition (TAs) positions a source with subpixel accuracy on a specific location on the detector.
On this page
TAs are supported for 2 NIRISS observing modes: single object slitless spectroscopy (SOSS) and aperture masking interferometry (AMI). While a TA is only required for those observing modes when a subarray is used, it is also strongly recommended for the full frame detector readout to ensure that the target is always placed on the same detector pixel.
Target acquisition procedure
Steps in the NIRISS TA procedure are described below:
- The target is located:
- Three 64 × 64 pixel subarray exposures are taken; images are offset from each other (dithered) by a small integer pixel in X and Y to allow for removal of bad pixels.
- Onboard TA software processes the images (aligns the images, flags bad pixels, removes cosmic rays, and subtracts the background level) and applies a centroiding algorithm to determine the target coordinates (see Target location algorithm below).
- The spacecraft is moved to place the target at the nominal center of the TA subarray being used, which is listed in onboard tables.
- The target is re-imaged with a single (undithered) exposure. This is the so-called "TA verification" exposure.
- If the observing mode is AMI, the spacecraft is moved to the science aperture which is located on a separate (but nearby) subarray. This is done to avoid any persistence from the TA images. (This step is not performed for the SOSS observing mode, for which the spectra are projected onto a different location on the detector, so that the telescope does not have to be moved.)
A TA exposure sequence produces scientific data—images of the target produced in steps 1 and 3. These data will be returned to the observer along with the other science data.
Target location algorithm
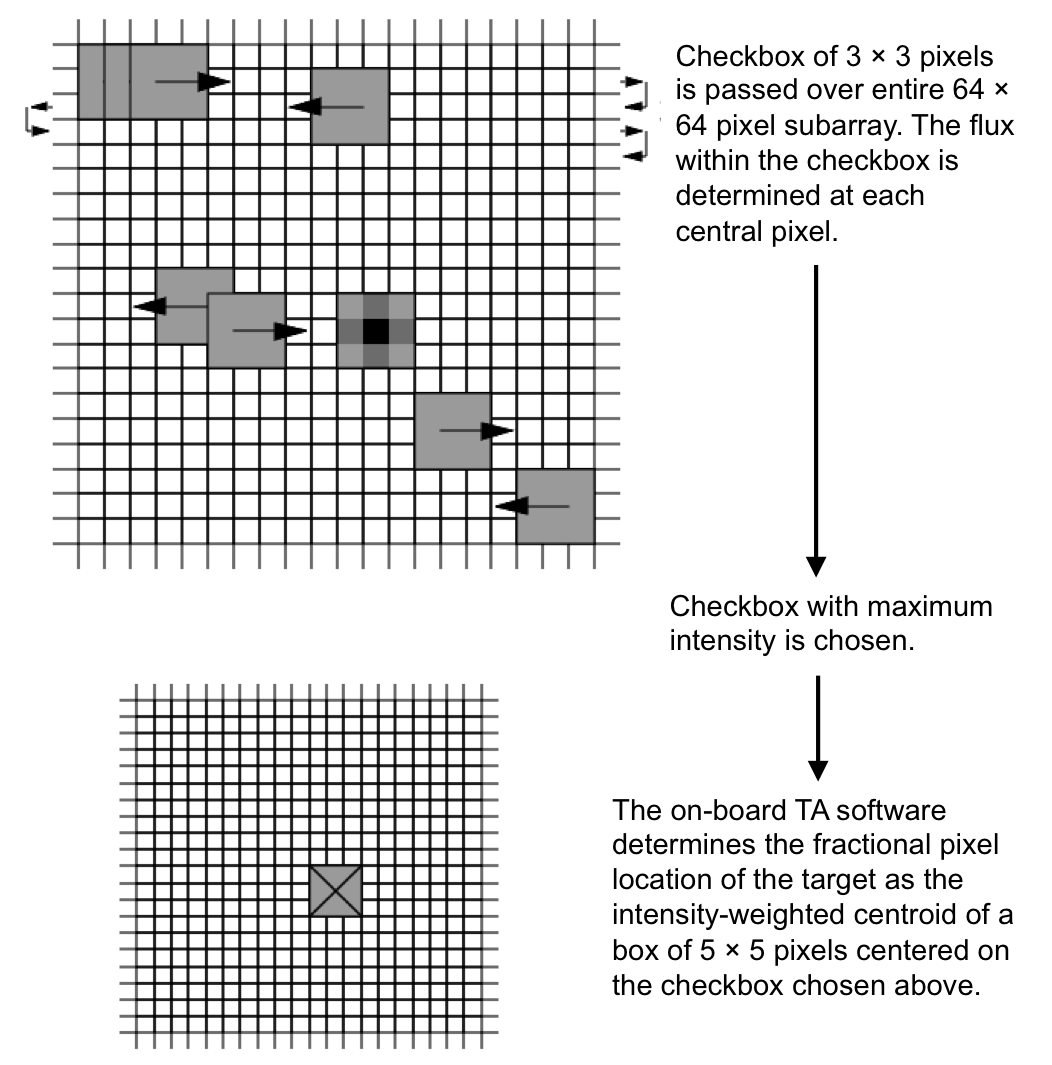
To locate the target, the onboard software first passes a square checkbox of 3 × 3 pixels (0.196 × 0.196 arcsec2) over the TA subarray image and determines the intensity contained within the checkbox at each pixel in the subarray. The software then selects the checkbox with the maximum intensity and determines the flux-weighted centroid of the target using a 5 × 5 pixel window centered on that checkbox (see Figure 1 below).
Generally, the TA will be performed on the science target of the observation, though it is allowed to perform the TA on an object within 30"–80" of the science target (where the exact maximum distance depends on Galactic latitude).
Target acquisition modes
See also: NIRISS Non-Redundant Mask, NIRISS Pupil and Filter Wheels
Words in bold are GUI menus/
panels or data software packages;
bold italics are buttons in GUI
tools or package parameters.
Table 1. Recommended magnitude ranges for NIRISS TA Modes
| TA mode | PW element | Target magnitude |
|---|---|---|
| SOSSBRIGHT | NRM | 2.9 ≤ M ≤ 6.0 |
| SOSSFAINT | CLEARP | 6.0 ≤ M ≤ 14.4 |
| AMIBRIGHT | NRM | 2.9 ≤ M ≤ 9.2 |
| AMIFAINT | CLEARP | 9.2 ≤ M ≤ 14.4 |
A TA exposure time, one that achieves a signal-to-noise ratio (SNR) of at least 30, is best determined using the Exposure Time Calculator (ETC). This enables a centroid accuracy of ≤0.15 pixel. However, increasing the TA exposure time to get a higher SNR should be considered while planning observations for which accurate centroiding is deemed crucial. For example, the centroiding accuracy improves to about ≤0.10 pixel at SNR = 50 and to about ≤0.05 pixel at SNR = 100. More information on the use of the NIRISS TA ETC is given in the JWST ETC NIRISS Target Acquisition article.
The WISE W2 magnitude should be used as the M magnitude in Table 1 above. If there is no WISE W2 magnitude available for the target acquisition source, then other M-band magnitudes (e.g., Spitzer 4.5 µm photometry) can be used. If that is unavailable, then the WISE W1 magnitude can be used. If the source is not detected by WISE in either the W1 or W2 band and there is no Spitzer 4.5 µm data, then the M band magnitude can be estimated via K band photometry, using Table 2 or Figure 2 for lower mass, cooler stars.
Table 2. K-M colors to estimate M magnitude from K band photometry
| Spectral Type | Teff (K) | K-W1 | K-W2 | Spectral Type | Teff (K) | K-W1 | K-W2 |
|---|---|---|---|---|---|---|---|
| A0 | 9480 | 0.00 | 0.00 | K0 | 5240 | 0.03 | -0.02 |
| A2 | 8810 | 0.00 | 0.01 | K2 | 5010 | 0.03 | -0.03 |
| A5 | 8160 | 0.00 | 0.01 | K4 | 4560 | 0.03 | -0.05 |
| A7 | 7930 | 0.01 | 0.01 | K5 | 4340 | 0.06 | 0.01 |
| F0 | 7020 | 0.01 | 0.01 | K7 | 4040 | 0.13 | 0.15 |
| F2 | 6750 | 0.01 | 0.01 | M0 | 3800 | 0.14 | 0.17 |
| F5 | 6530 | 0.01 | 0.01 | M1 | 3680 | 0.15 | 0.21 |
| F7 | 6240 | 0.01 | 0.00 | M2 | 3530 | 0.15 | 0.26 |
| G0 | 5930 | 0.02 | -0.01 | M3 | 3380 | 0.16 | 0.28 |
| G2 | 5830 | 0.02 | -0.01 | M4 | 3180 | 0.18 | 0.32 |
| G4 | 5740 | 0.02 | -0.01 | M5 | 3030 | 0.19 | 0.34 |
| G6 | 5620 | 0.02 | -0.01 |
References
Allard, F. & Freytag, B., 2011, ASPC, 448, 91
Model Atmospheres From Very Low Mass Stars to Brown Dwarfs
Goudfrooij, P., 2017, JWST-STScI-005934
NIRISS Target Acquisition: the sensitivity of centroid accuracy to the presence of saturated pixels

