ExoCTK Groups and Integrations Tool
In planning JWST exoplanet observations, ExoCTK's Groups & Integrations Calculator provides a framework for estimating the number of groups and integrations for a given transiting exoplanet exposure.
On this page
See also: Understanding Exposure Times, JWST Exposure Time Calculator Overview, JWST Data Volume and Data Excess
ExoCTK's Groups & Integrations Calculator is a JWST observation planning tool for transiting exoplanet observations that calculates the optimal number of groups and integrations. Information about the target star, transit characteristics, and planned instrument settings are entered into the tool. It uses pre-calculated exposure parameters for a range of magnitudes and stellar spectral types (from Pandeia, which powers the JWST ETC) to interpolate saturation limits for the input information. The tool uses this to calculate the optimal number of groups and integrations—that maximize observing efficiency without saturation—for use in observation planning.
The Groups & Integrations tool is designed to be a quick-look tool to determine the optimal number of groups and integrations for a given transiting exoplanet observation. Currently, this tool is likely to overestimate saturation in comparison to the ETC; it may predict fewer groups and put users in less danger of over-saturating their observation.
The Groups & Integrations Tool can be used via a web form, as described below.
Using the web interface
Words in bold are GUI menus/
panels or data software packages;
bold italics are buttons in GUI
tools or package parameters.
Figure 1. Groups & Integrations on ExoCTK's homepage

- The optional Target Name field (e.g., "WASP-18 b"); if used, clicking the Resolve Target button will reload the page with Stellar Parameters fields automatically filled out. These parameters are retrieved from Exo.MAST, as shown in Figure 2.
- If no target is specified, provide values for the two Stellar Parameters fields; enter the K-band Vega magnitude of the target star and select an appropriate Phoenix stellar atmosphere model from the drop-down list.
- The length of the observation, Observation Time, either in units of hours or days.
- Parameters that define the exposure, as shown in Figure 3. These are the number of Groups per Integration (to optimize this number, enter 0), the Instrument, as well as science and target acquisition Filters and Subarrays.
- A Maximum Saturation level for the given instrument configuration. Saturation can be specified as counts or full well percentage. Then, enter the appropriate amount in The level of saturation field, as shown in Figure 4. As with PandExo, the presented saturation levels are signal limits and not actual full well depths of the detectors (for more details on this terminology, see the JWST Time-Series Observations TSO Saturation article).
Figure 2. Groups & Integrations target input interface

Figure 3. Groups & Integrations inputs

Figure 4. Defining maximum saturation

Click on the figure for a larger view.
Understanding the Groups & Integrations Tool output tables
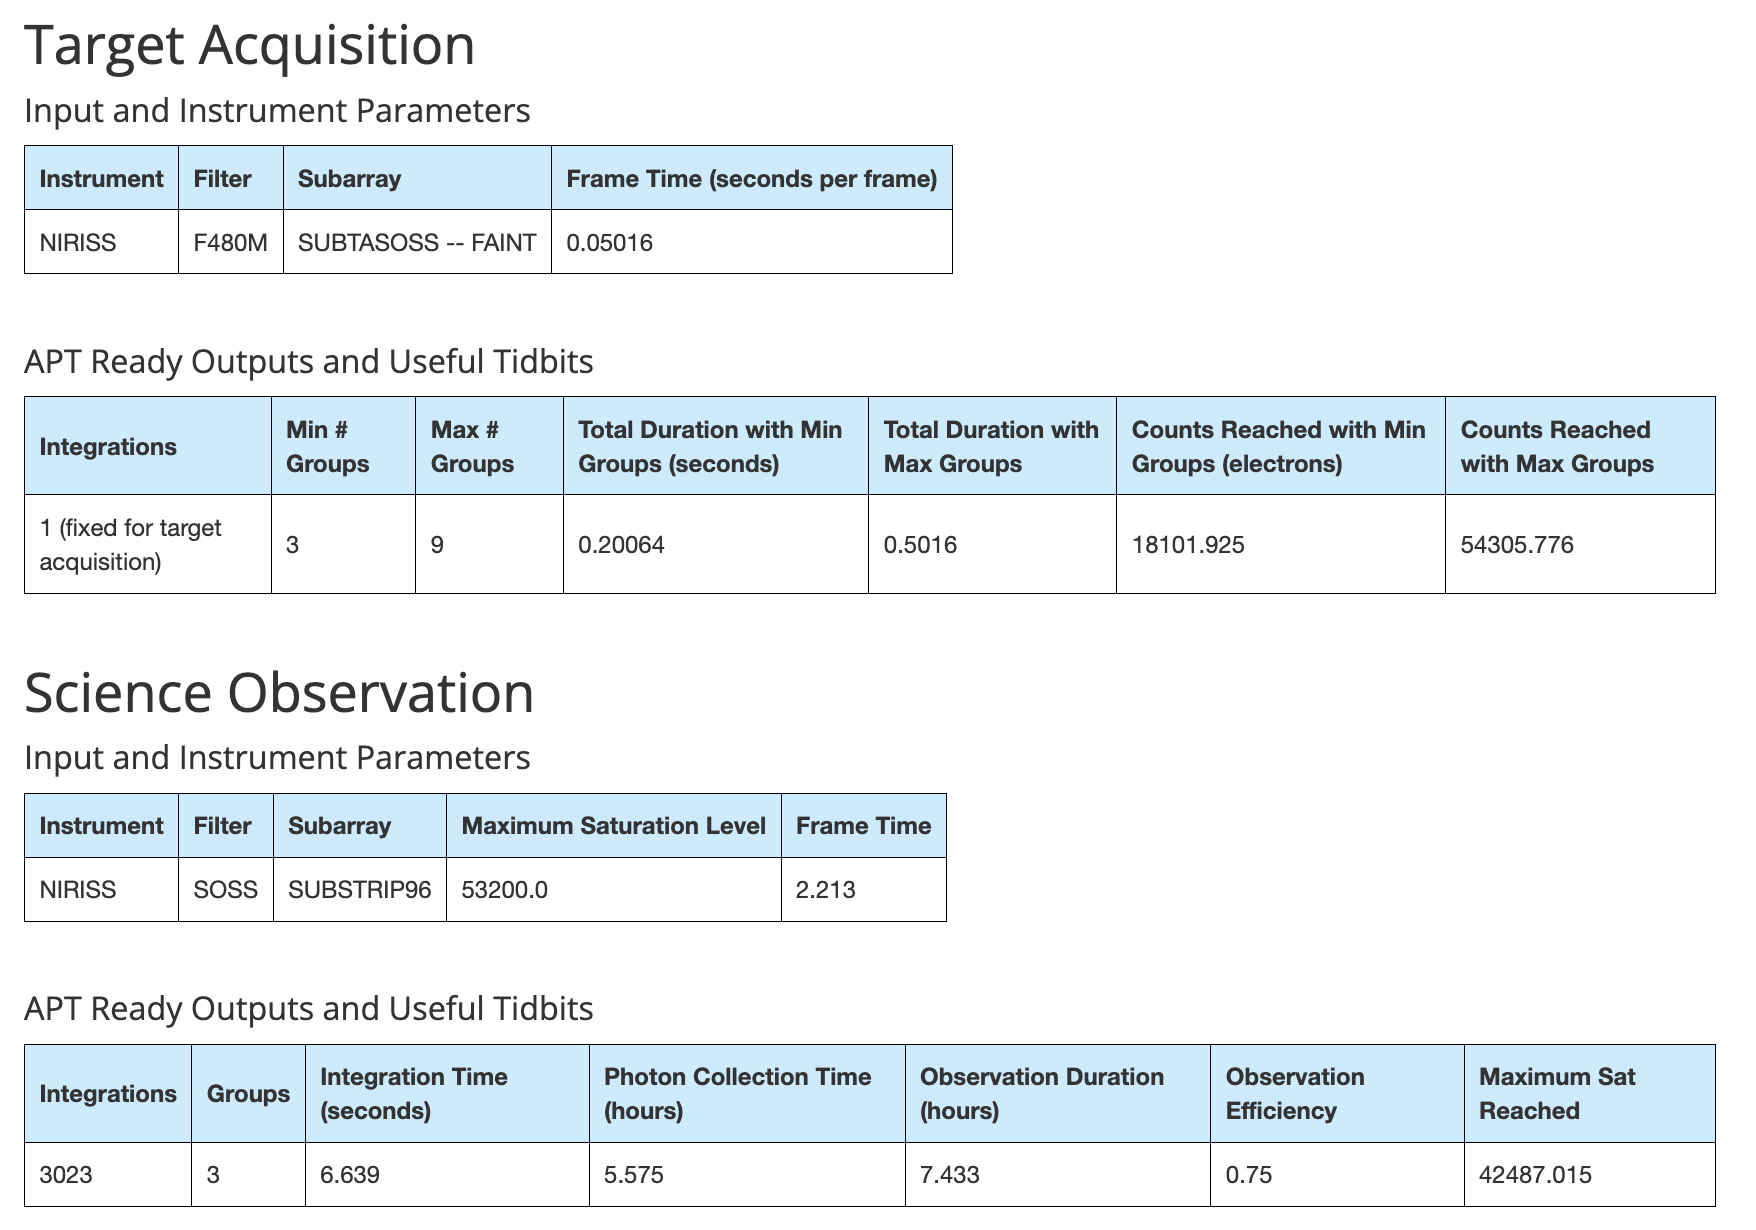
Once the calculation is complete, you will be redirected to a results page, with a layout similar to the one shown in Figure 5. The results page has 5 output tables. The first table, called "Source Specifics," (not shown in Figure 5) contains the stellar properties and transit observation time values used for the calculation, entered earlier in the web form.
The 4 tables in Figure 5 are split into 2 sections: "Target Acquisition" and "Science Observation." Each section contains information about the target acquisition and the science observation.
In each section, the first table shows the input and instrument parameters and the second table shows some ready-to-be-ingested APT information.
For "Target Acquisition," the second table shows the results for the minimum and maximum number of groups so the user can select the one that best accommodates their observations.
For the second table under "Science Observation," if Groups per Integration was set to 0, the table shows optimal values to maximize observational efficiency; otherwise, it shows results for the Groups per Integration value provided by the user.
Figure 5. Groups & Integrations output example
Click on the figure for a larger view.