MIRI Instrument Features and Caveats
Content Migration
WARNING: This page has been deprecated and the content migrated to MIRI Known Issues. Please update your links accordingly.
The JWST MIRI instrument has a number of features and characteristics that observers should be aware of when planning, reducing, analyzing and interpreting observations. This article provides an overview of several features and caveats that should be noted and that may affect the data and resulting science.
On this page
Detector general features and caveats
Cruciform artifact
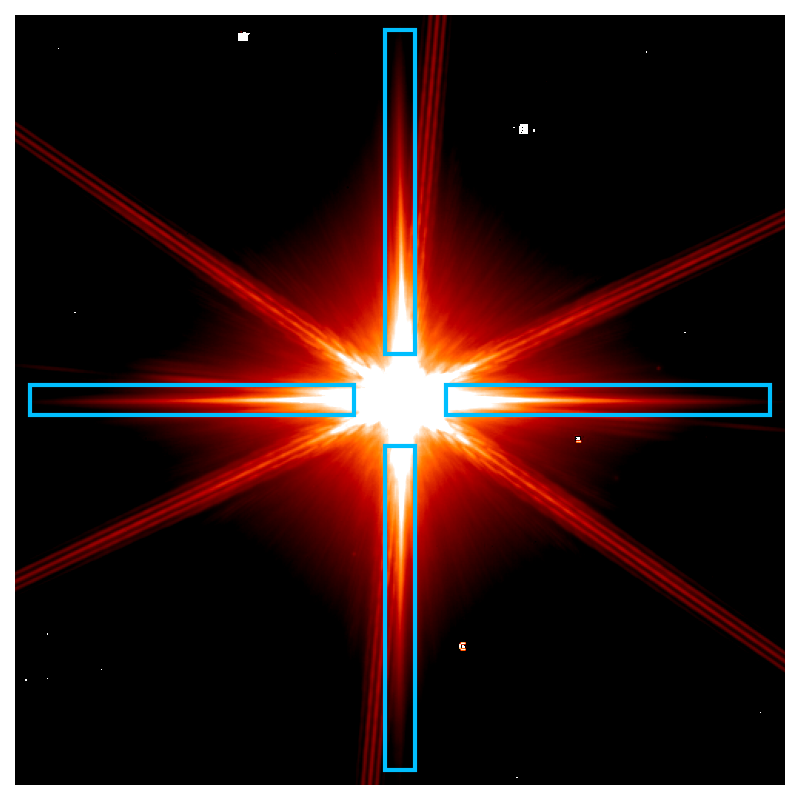
There is a feature caused by internal scattering within the MIRI detectors that manifests as a cruciform shape in imaging and spectroscopy at wavelengths ≤ 10 μm.
The Si:As detectors used by MIRI are tasked with observing a large wavelength range, from 5.6 to 30 μm. Inherently, these detectors are lower in quantum efficiency at the shorter wavelength range of this window, absorbing less than 27% of the photons on their first pass through the absorptive layer at 5.6 μm. The remaining photons are diffracted by the square pixel lattice, resulting in a classic cruciform-shaped diffraction pattern that follows the row and column directions of the detector.
Since the MIRI imager (field of view) FOV is rotated by 4.835° from the V3 axis, the cruciform artifact is also rotated by this amount from the OTE/hexagon diffraction spikes. The cruciform artifact is strongest at the shorter wavelengths and disappears mostly by 12 μm (see Figure 1 below. The inner region of the PSF core does not show the cruciform artifact, due to photons being able to escape the detector wafer within the total internal reflection limit. For more information, please see Gaspar et al. (2021).
Hot or dead pixels
The MIRI imager detector has several pixels that are flagged based on ground testing and in-orbit observations. These pixels are flagged as "DO_NOT_USE" in the flight bad pixel mask (Figure 2), and the pipeline will not use those pixels.
Figure 2. MIRI Imager bad/hot/dead pixel mask
![]()
Shorted columns
Two of the columns (385 & 386) on the MIRI imager array are shorted. These are flagged in the flat field bad pixel mask as "UNRELIABLE_SLOPE" (see Figure 2 above).
Residual dark features
Data are still being evaluated, and updates will be provided soon.
Brighter-fatter correction
Saturated pixels affect the flux of neighboring pixels and "fatten" the PSF. A correction for this effect is still under development.
Column/row pull up/pull down
The column/row pull up/pull down effect is a form of electronic cross talk. It manifests itself as an overall signal increase (pull-up) or decrease (pull-down) of the flux in columns and rows with strong sources. There is a flux dependency in the effect, and exhibits differences between the impact in rows and columns. See Dicken et al. 2022 for further discussion.
Residual cosmic ray artifacts (large & weird)
MIRI experiences cosmic ray "showers." The baseline jump algorithm detects the primary hit, and smaller, brighter secondaries, but not the lower level glow, sometimes resulting in latent artifacts in the data if not dithered using large offsets. The pipeline flags these showers in an extra step. There are varying types of showers, some with no primary hit, for example, that are not currently flagged by the pipeline. Large dithers mitigate the effects of such showers.
Imager
See also: MIRI Imaging
Imager "scar"
The imager scar consists of a diagonal feature on the top-left part of the MIRI imager, centered at pixel (428,987) with a length of 16 pixels. This is related to a scratch on the surface of the detector. Although the pixels are responsive, this feature can scatter the light in both directions perpendicular to the scratch.
When the pixels associated with the scar are uniformly illuminated (no sources and just background), 2 diagonal features can run parallel to the scar (Figure 4). These stripes are brighter than the local background and their position and width change as a function of wavelength.


Imager knife edge
The MIRI imager has a protrusion from a knife edge structure that blocks a small portion of the field of view (FOV) on the left side, and is used for optical testing. The main effect will be on mosaics (see Knife Edge Gap in MIRI Imaging Mosaics). The default MIRI imaging mosaic overlap of 10% is used to address the gap.
Bonus Lyot FOV in imaging
Because the Lyot coronagraph has no additional optics, the Lyot FOV provides valid, calibrated data except where the Lyot occulting spot and support structure prevent light from reaching the detector.
Edge brightening
The in-flight imaging FOV exhibits some stray light features on the left and bottom edges. These should not have a significant impact on combined dithered or mosaicked imaging. Additional analysis is underway.
Figure 6. Edge brightening in the MIRI imager field of view, also showing the scattered light features in the MIRI coronagraphs

Coronagraphs
See also: MIRI Coronagraphic Imaging
Why are the coronagraph masks at an angle in the focal plane?
The support structure for the Lyot coronagraph, and the quadrant boundaries for the 4QPM coronagraphs, are tilted at 4.835° relative to the rows and columns of the imaging detector (see MIRI Coronagraphic Imaging). Since MIRI is tilted by this same amount in the telescope focal plane, the tilt in the coronagraphs is necessary to align the coronagraph masks with the pupil structures in the OTE.
TA PSF asymmetry in 4QPM coronagraphs
The MIRI coronagraphic imaging target acquisition (TA) process uses one of 4 broadband filters: F560W, F1000W, F1500W, and the neutral density filter (FND). In-flight data shows that the point spread function (PSF) exhibits an asymmetry caused by internal reflection in the 4QPM germanium optics. This asymmetry is a function of the difference between the central wavelengths of the TA filter and the operating wavelength of the specific 4QPM. The most extreme asymmetry is for the F560W TA filter and the F1550C coronagraph. Tests of the TA process have shown that this asymmetry is uniform across the coronagraph FOVs—it only imparts a small offset to the TA which has been compensated for in the TA process. Because there are no optics at the Lyot coronagraph occulting spot and support structure, the TA PSFs for the Lyot coronagraph are unaffected.
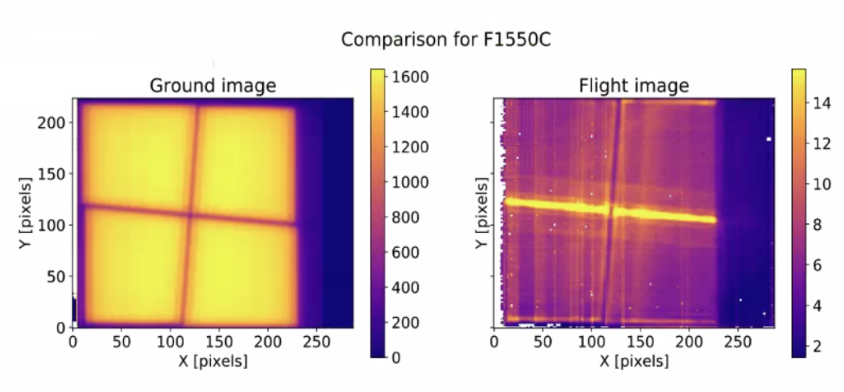
Glow sticks in the MIRI 4QPM coronagraphs
Fight data has shown that there is light being scattered into the coronagraphs. This is particularly apparent for the 3 4QPMs, where it manifests as a glow along the horizontal boundaries of the phase masks. These are referred to as glow sticks; they can be removed by (1) a dedicated background observation, (2) angular differential imaging (ADI) processing where a telescope roll has been used for 2 or more observations of the science target, or (3) by reference star PSF subtraction if the reference star has the same brightness and exposure time as the science target. At present, these glow sticks appear to mostly increase the shot noise.
Figure 7. Scattered light in the 4QPM coronagraphs
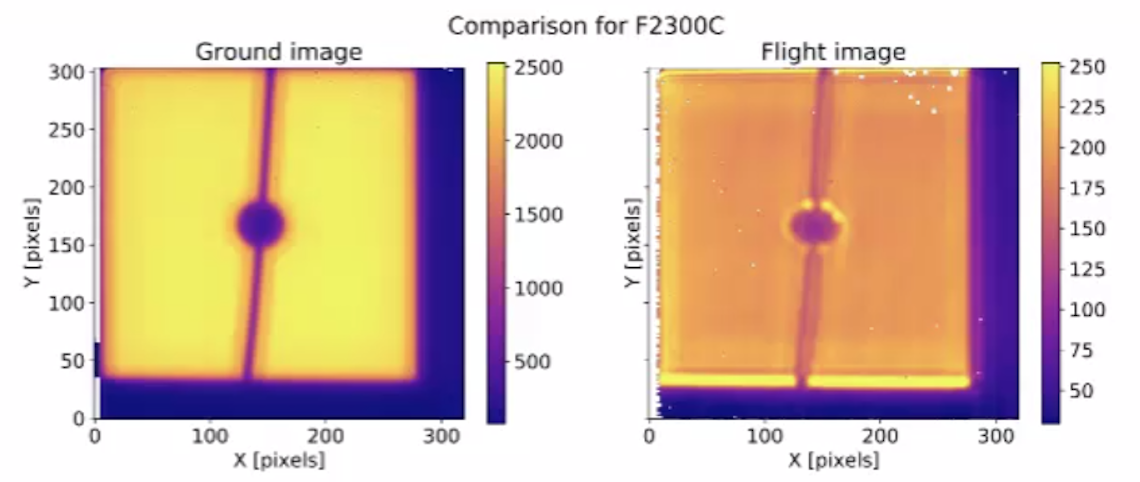
Edge brightening around the Lyot spot and lower edge of the Lyot FOV
In-flight data show that, as for the imager, there is light scattered into the Lyot FOV that slightly illuminates the rich-hand edge of the occulting spot and the support structure. This scattered light can be removed by either (1) a dedicated background observation, (2) ADI processing where a telescope roll has been used for 2 or more observations of the science target, or (3) by reference star PSF subtraction if the reference star has the same brightness and exposure time as the science target.
Figure 8. Scattered light in the Lyot coronagraph
Low-resolution spectrometer (LRS)
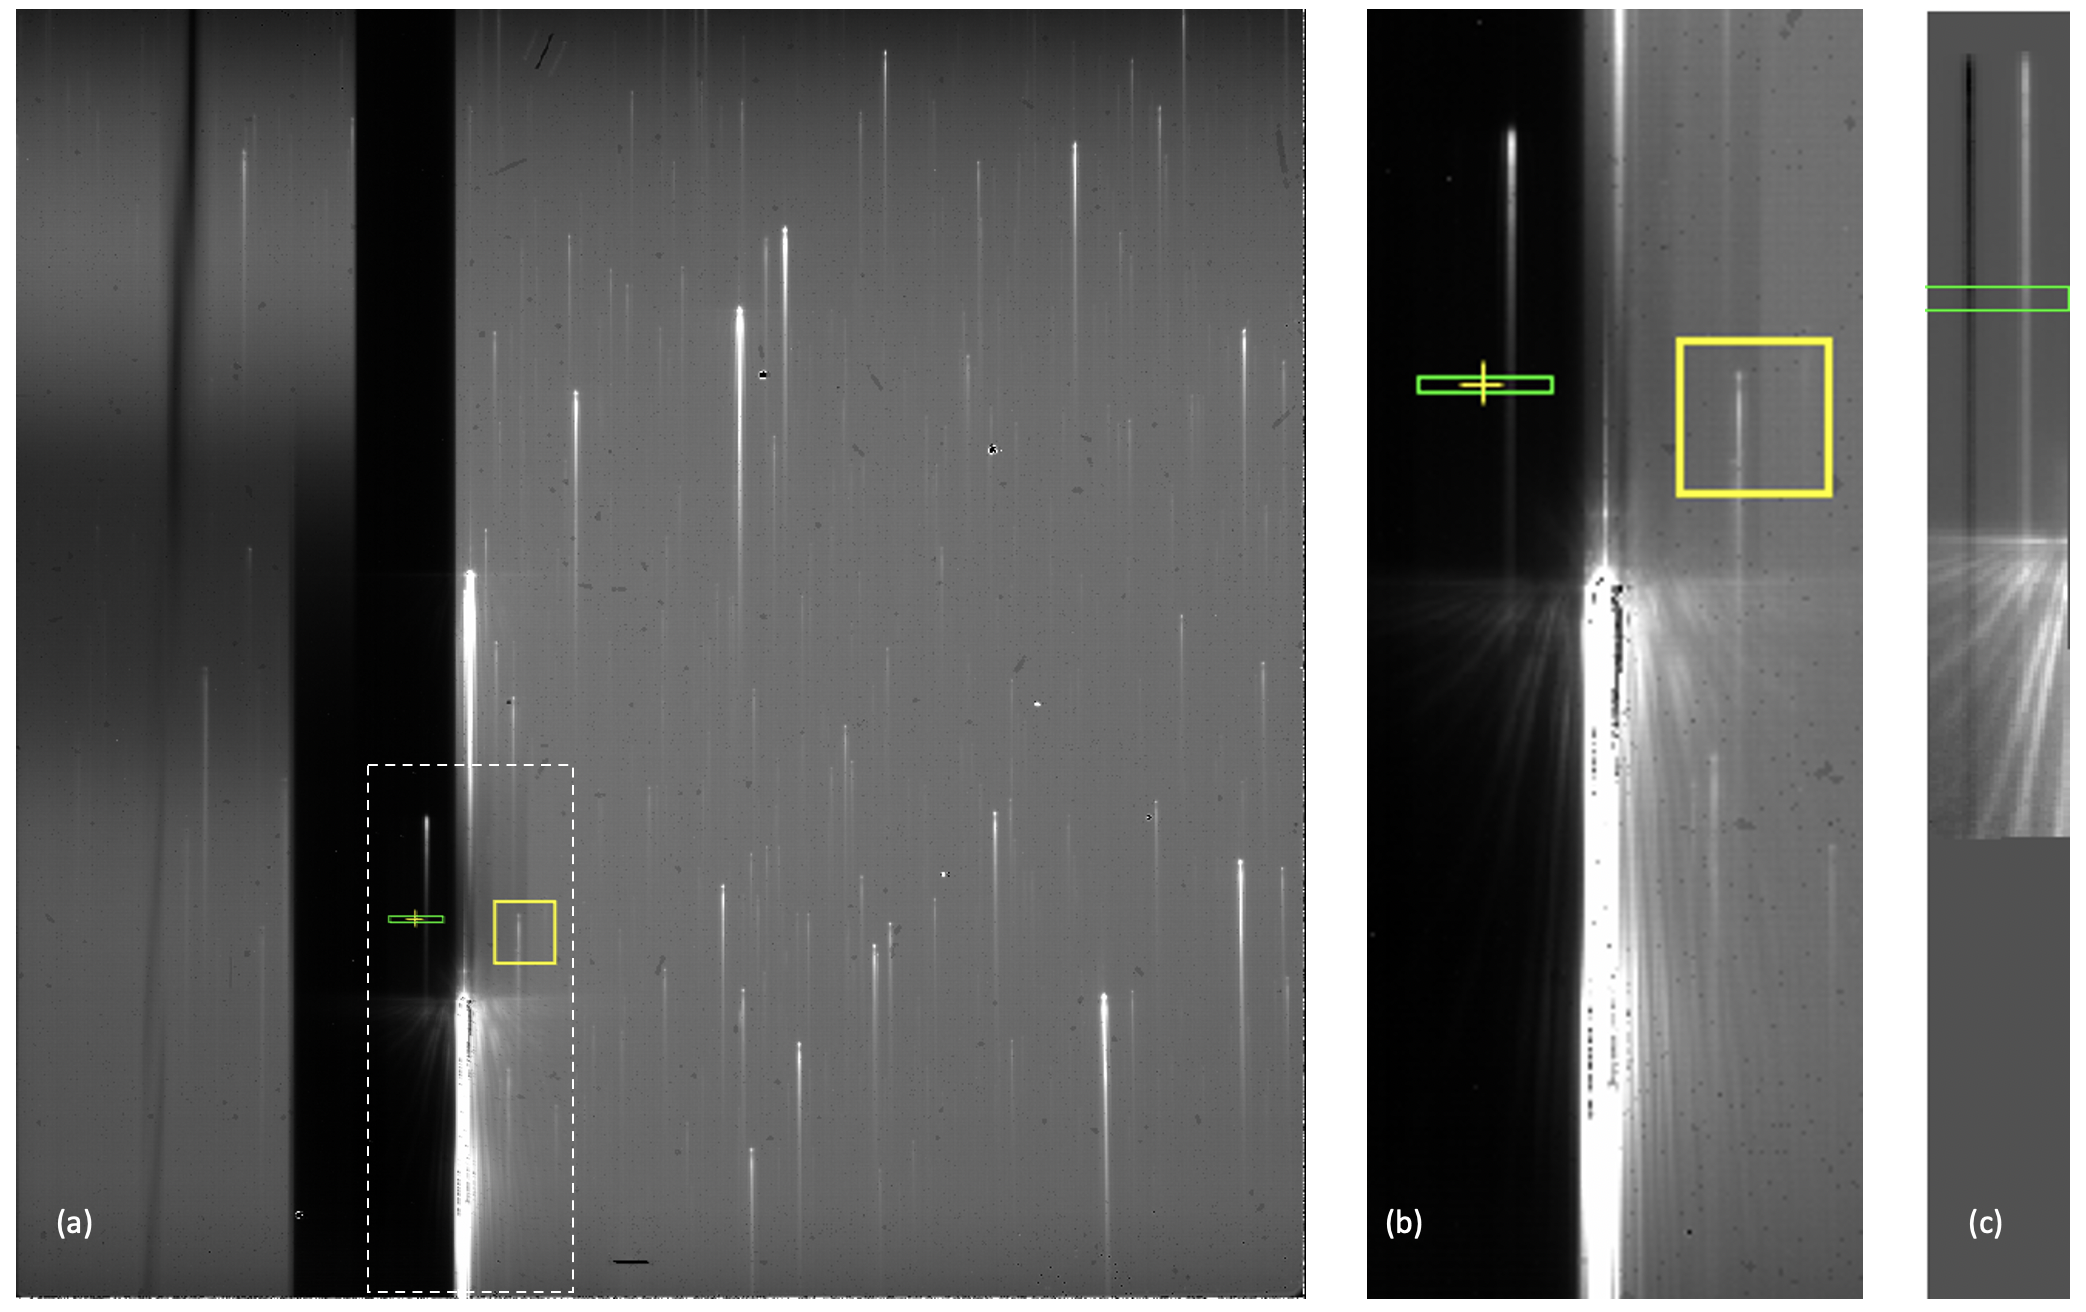
Scattered light in the LRS
See also: MIRI Low Resolution Spectroscopy
If a very bright target is present in the imager field, its light may scatter into the region where the LRS slit is dispersed. We see scattered light artifacts in the detector substrate around bright sources (see the cruciform artifact), so these features can persist despite the presence of a focal plane mask. As the pipeline extracts a cutout region from the array in the later stages of the stage 2 pipeline (the photom and resample_spec steps), we recommend that users inspect Level 2a data (the "rate.fits" file) to check for the presence of such contaminating sources.
Figure 9. Light scattered from the imager field of view into the LRS spectral location
LRS slitless spectral foldover and leak
As both slit and slitless modes use the same dispersing element, the dispersion profile is similar for both, modulo changes due to optical distortion. The nominal spectral range of 5–12 µm is dispersed over ~370 pixels. The dispersion profile however folds over below 4.5 µm (where the prism throughput is very low), superimposing 2 parts of the spectrum onto each other. A dedicated filter is mounted over the slit to block radiation shortward of 4.5 µm to avoid this contamination in the slit. This effect is not mitigated for LRS in slitless mode, causing some spectral contamination at the shortest wavelengths.
Medium resolution spectrometer (MRS)
See JWST MIRI MRS Pipeline Caveats
References
Gaspar, A. et al. 2021, PASP, 133, 1019, 15
The Quantum Efficiency and Diffractive Image Artifacts of Si:As IBC mid-IR Detector Arrays at 5-10 μm: Implications for the JWST/MIRI Detectors
Dicken, D. et al. 2022, Proc. SPIE, 12180, 121802R
Row and column artifacts in JWST MIRI’s Si:As blocked impurity band detectors